Technical Analysis – AUDUSD remains above 200-day SMA
AUDUSD battles with 50-day SMA
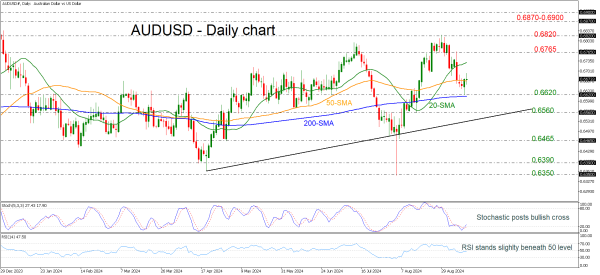
Stochastics point north but RSI flattens
Momentum signals are neutral-to-bullish, with the RSI appearing to be heading south, while the stochastic oscillator has reversed higher after the bullish crossover within its %K and %D lines in the oversold area.
Should the price continue to decline, the 0.6620 support could be a significant barrier to keep in mind because it overlaps with the 200-day SMA. Below that, the focus could shift straight to 0.6560, which is close to the short-term uptrend line.
On the other hand, a recovery could retest the 20-day SMA at 0.6730 before turning attention to the 0.6765 resistance. Moving higher, the 0.6820 bar should be another tough obstacle for traders as the price paused its uptrend at the end of August.
Looking at the short-term picture, the bullish outlook reemerged following the unsuccessful attempt to break below the 200-day SMA. For a bull market, traders need to wait for a clear close above 0.6820.Overall, AUDUSD is currently holding a positive profile both in the medium- and long-term timeframes.