Technical Analysis – AUDUSD: Will September’s bullish vibes return?

- AUDUSD tests support area near 200-day SMA
- Short-term bias remains on the negative side
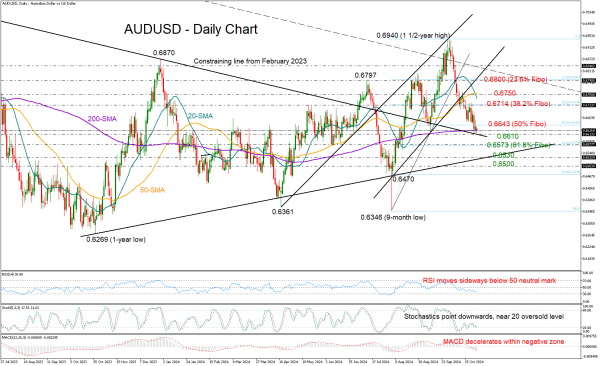
AUDUSD has been on a downward slide again, marking its fourth consecutive week in the red. It recently dipped to a two-month low of 0.6612 but held above the 200-day simple moving average (SMA) and the constraining falling line from February 2023, which increases speculation as to whether the sell-off is finally hitting a bottom.
Remember back in September when those support lines gave the price a nice boost? Well, as long as they stay in play there is hope for a bullish reversal. However, the mood is still a bit cautious, with the RSI and the MACD reflecting persistent selling appetite. If the price dips below 0.6610, support could come from the 61.8% Fibonacci retracement level around 0.6573. If that doesn’t hold, the pair could next head for the ascending trendline at 0.6530, and if that breaks as well, watch out for the protective zone between 0.6470 and 0.6500.
On the brighter side, if AUDUSD can bounce back above the 50% Fibonacci level at 0.6643, it could see some momentum building up to the 38.2% Fibonacci level at 0.6714. And if it climbs above the 0.6750 resistance, where the 50-day SMA hangs out, that could really get things moving towards the 23.6% Fibonacci level at 0.6800.
In summary, while AUDUSD has not overcome downside risks, a recovery attempt could be possible as the pair is currently testing a familiar pivot area.