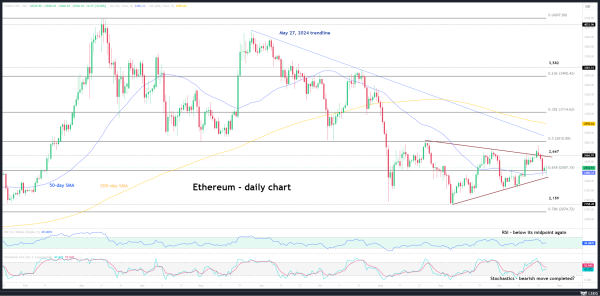
Technical Analysis – Ethereum hovers above key support levels

- Mixed movements in cryptocurrencies this week
- Ethereum is under pressure, trading a tad above 2,507
- Momentum indicators are currently directionless
Ethereum is having a bad week, significantly underperforming against bitcoin. It is currently trading a tad above the 61.8% Fibonacci retracement level of the October 13, 2023 – March 12, 2024 uptrend of 2,507, inside the developing symmetrical triangle. At least, it managed to record a higher high on October 21 and, provided that the next trough is above 2,300, the current short-term bullish trend that commenced in early September could remain alive.
In the meantime, the momentum indicators are mostly directionless. The RSI is hovering around its midpoint, potentially preparing for the next leg in ethereum. Interestingly, the stochastic oscillator has stopped its downward movement, and it is trading a tad below its midpoint. Should it restart its downleg, this week’s bearish pressure in ethereum could get a boost.
Should the bulls remain confident, they would try to keep ethereum above the 61.8% Fibonacci retracement level of 2,507, and gradually push it higher towards the mid-September 2021 low of 2,667. Another breakout from the triangle pattern could then be on the cards, although a decisive rally, potentially above the 50% Fibonacci retracement level at 2,810, could be needed to validate the move.
On the other hand, the bears are still thirsty. Three important support levels - the 61.8% Fibonacci retracement level, 50-day simple moving average (SMA) and the lower trendline of the triangle pattern at 2,507, 2,486 and 2,440 respectively - stand in their way. Should they manage to break below these levels, the path could be then clear until the 2,159 low.
To conclude, ethereum remains on the back foot, and a move below certain key support levels could result in a protracted selloff.