Technical Analysis – ETHUSD declines sharply towards 50-day SMA
ETHUSD posted 2-month high following ETF approval
But retraced lower after a consolidation period
Momentum indicators drop to negative territories
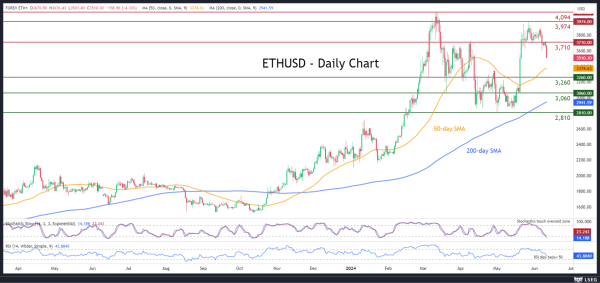
Should the pullback extend, initial support could be found at the March-April support of 3,260. Slicing through that barrier, the price might test the March bottom of 3,060. Lower, the bears could attack the May low of 2,810.
On the flipside, if the price reverses back higher, the April resistance of 3,710 could prove to be the first barricade for the bulls to overcome. A break above that zone could open the door for the recent two-month peak of 3,974. Further advances could then come to a halt at the 2024 peak of 4,094, which is also a more than two-year high.
Overall, ETHUSD has been experiencing a strong pullback in the past few sessions on the back of a stronger-than-expected NFP report. Moving forward, a test of the 50-day simple moving average (SMA) could decide whether the downside correction could deepen.