Technical Analysis – EURJPY moves within consolidation area

- EURJPY struggles to drop beneath 38.2% Fibonacci
- MACD and RSI have weak momentum
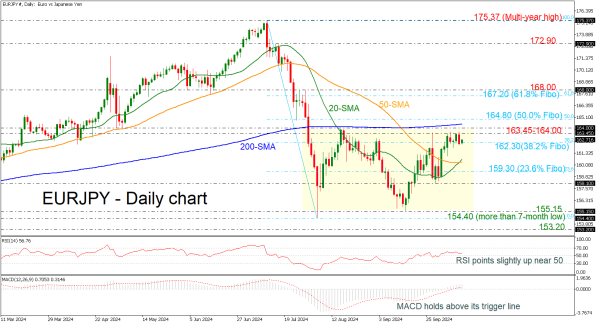
EURJPY has been developing within a trading range of 155.15-164.00 over the last couple of months, with strong resistance coming from the 200-day simple moving average (SMA) around 164.40.
Technically, the RSI is pointing slightly above the neutral threshold of 50; however, the MACD is failing to extend its positive momentum, moving horizontally above its trigger and zero lines.
If the market rises above the upper boundary of the sideways channel and the 200-day SMA, then it may rest near the 50.0% Fibonacci retracement level of the downward wave from 175.37 to 154.40 at 164.80. Even higher, the 61.8% Fibonacci level of 167.20 could potentially halt the upward trend.
Alternatively, the 38.2% Fibonacci of 162.30 is acting as a significant support level, and a slip below it could take the bears until the bullish crossover within the 20- and 50-day SMAs at 160.30. Below that, the 23.6% Fibonacci of 159.30 may attract traders’ attention as well.
All in all, EURJPY is failing to have a clear direction, and only a move above 164.00 or below 155.15 would change the current outlook.