Technical Analysis – Facebook stock holds bullish bias but strong resistance awaits near SMAs
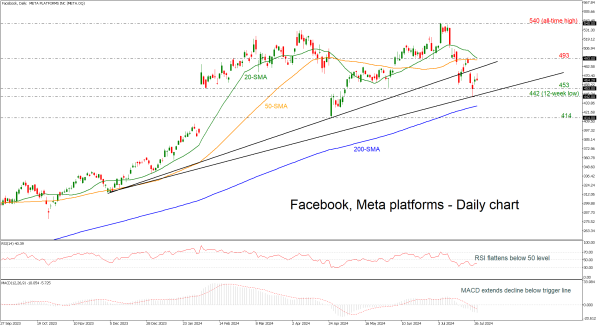
Facebook stock pulls back off 442
Uptrend line acts as support level
RSI and MACD suggest more decreases
Facebook stock price has rebounded somewhat after falling to a 12-week low of 442 on July 25 but momentum indicators now suggest that the market sentiment might get worse before getting better as the RSI is reversing to the downside below its 50-neutral threshold. The MACD also looks to be moving lower beneath its trigger and zero lines.
Should bearish dynamics dominate, the market might revisit the 453 bottom before meeting the previous low of 442 and the long-term ascending trend line. Below that, the 200-day simple moving average (SMA) at 430 could be another potential barrier in focus, while steeper declines would change the broader outlook to bearish.
Alternatively, if the price manages to move higher, nearby resistance could come from the 20- and the 50-day SMAs near the 493 resistance level. A decisive close above the latter could open the door for a battle with the record peak of 540.
To summarize, Facebook stock bias looks positive in the long-term; however, a break beneath the 200-day SMA could be the green light the bears need.