Technical Analysis – Gold bounces off 50-day SMA
Gold was retreating from its all-time high
But the 50-day SMA prevented further declines
Despite latest weakness, oscillators remain neutral-to-positive
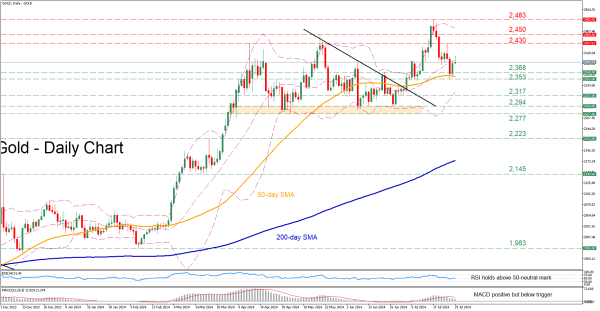
Gold had been in a strong uptrend since late May, which led to a fresh all-time high of 2,483 on July 17. Although bullion has been experiencing a significant pullback since then, the 50-day simple moving average (SMA) seems to be capping its downside for now.
Should the recent bounce off the 50-day SMA turn into a rebound, immediate resistance could be found at the April high of 2,430. Conquering this barricade, the bulls may attack the May high of 2,450. A violation of that zone could pave the way for the recent record peak of 2,483.
On the flipside, if gold reverses back lower, the previous resistance zone of 2,368 could act as the first line of defence. Failing to halt there, the price could descend towards the recent support of 2,353, which lies very close to the 50-day SMA. Further declines could then stall at 2,317, a region that provided downside protection both in June and July.
In brief, gold has come under significant selling pressure following its trip to a fresh all-time high. However, it’s too early to call for a sustained correction, especially as long as the 50-day SMA holds its ground.