Technical Analysis – Gold creates new bullish wave near record high
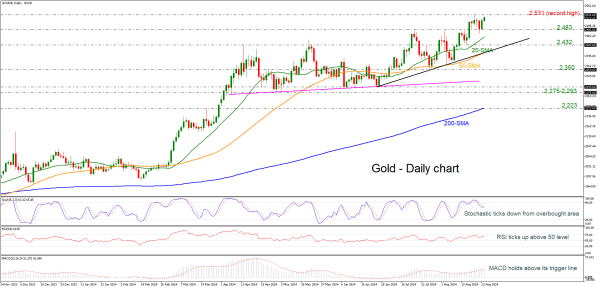
Gold rises above short-term SMAs
Stochastics turn down
MACD and RSI still have positive momentum
However, the technical signals are mixed. The stochastic oscillator is heading south from the overbought region; however, the RSI is ticking higher, approaching the 70 level. Moreover, the MACD oscillator is holding above its trigger and zero lines. The 20- and 50-day simple moving averages (SMAs) are pointing higher, while the current market price is standing well above the 200-day SMA.
In the negative scenario, a drop beneath the previous high could lead the market towards the 20-day SMA at 2,460, ahead of the 2,432 support. Even lower, the 50-day SMA at 2,406, which coincides with the short-term uptrend line, may halt downside actions.
All in all, the yellow metal has had a strong bullish tendency in the long- and short-term timeframes, and only a decisive close below the 200-day SMA could change the current outlook.