Technical Analysis – Gold flirts with short-term uptrend line
Gold lies within near-term SMAs
Momentum oscillators head down
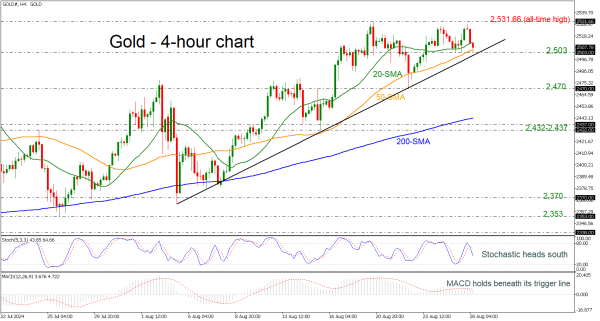
Currently, the price is challenging the 20- and 50-period simple moving averages (SMAs) in the 4-hour chart, with the technical oscillators showing some weakening momentum. The stochastic is heading lower, while the MACD stands beneath its trigger line above the zero level.
In case of a decline beneath the 2,503 support which holds near the ascending trend line, then the next support could come from 2,470. If traders continue to sell the commodity, then it may challenge the 200-period SMA at 2,443.
On the other hand, a bounce off 2,503 may drive the price higher, flirting with the record peak of 2,531.66 before moving towards the next round number of 2,600.
All in all, the yellow metal is bullish in the short-and long-term timeframes as long as it stands above the 200-period SMAs.