Technical Analysis – Intel stock battles with 50-day SMA
Intel shares advance after consolidation period
But struggle to conquer the 50-day SMA
Momentum indicators turn positive
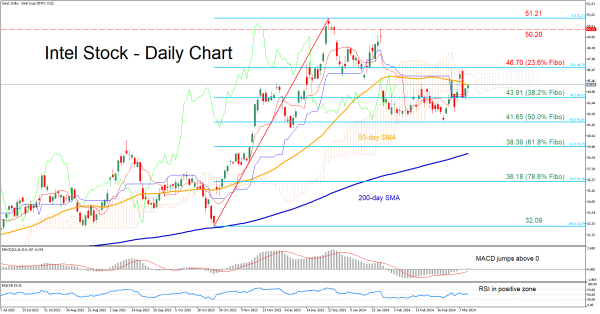
If bullish pressures persist and the price conquers the 50-day SMA, immediate resistance could be found at 46.70, which is the 23.6% Fibonacci retracement of the 32.09-52.21 upleg. Further advances could then stall at the January high of 50.20. Jumping above that zone, the stock could revisit its 2023 peak of 51.21.
On the flipside, bearish actions may send the price lower towards the recent support of 43.91, which coincides with the 38.2% Fibo. Failing to halt there, the stock may descend towards the 50.0% Fibo of 41.65. Even lower, the 61.8% Fibo of 38.39 could prevent further retreats.
In brief, despite temporarily breaking above the 50-day SMA, Intel’s stock rotated lower after testing the upper boundary of the Ichimoku cloud. Therefore, a clear jump above that region is needed for the rebound to resume.