Technical Analysis – NZDUSD hits a wall at the 200-day SMA
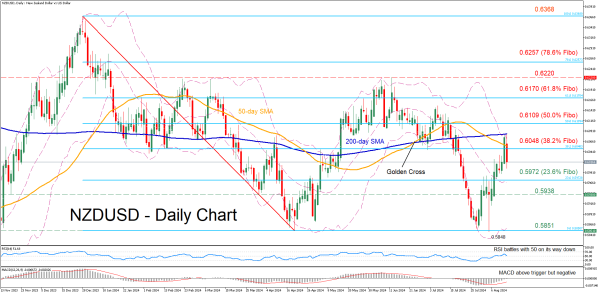
NZDUSD had been in a recovery mode since early August
But 200-day SMA rejects advance after dovish RBNZ meeting
Oscillators deteriorate, yet remain neutral-to-positive
Should the recent spike to the downside translate into a reversal, initial support could be found at 0.5972, which is the 23.6% Fibonacci retracement of the 0.6368-0.5851 downleg. Failing to halt there, the pair could descend towards the April support of 0.5938. A violation of that zone could pave the way for the 2024 bottom of 0.5848, a hurdle that held strong both in April and August.
Alternatively, bullish actions could send the price to test the 38.2% Fibo of 0.6048 ahead of its 50- and 200-day SMAs. Conquering the latter, the bulls may attack the 50.0% Fibo of 0.6109. Even higher, further advances could cease around the 61.8% Fibo of 0.6170.
In brief, the RBNZ cut rates by 25 basis points and communicated that they even considered a 50 bps reduction, applying the brakes on NZDUSD’s steep recovery. Hence, a decisive break above the 200-day SMA is needed for the bulls to regain confidence for a full-scale recovery.