Technical Analysis – NZDUSD hits fresh 2-month high
NZDUSD stages a V-shaped recovery from 2024 low
The pair jumps above 200-day SMA to its highest since June 14
Oscillators improve notably, suggesting increasing bullish bias
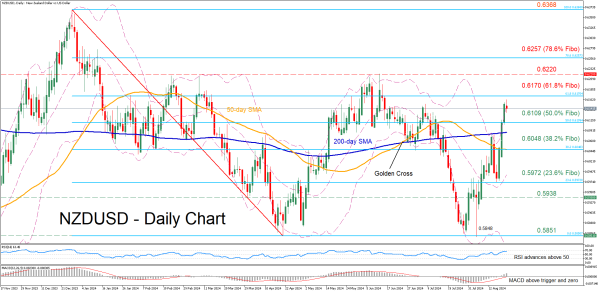
Should the recovery extend further, immediate resistance could be found at 0.6170, which is the 61.8% Fibonacci retracement of the 0.6368-0.5851 downleg. Conquering this barricade, the bulls may attack the June peak of 0.6220. Even higher, the 78.6% Fibo of 0.6257 may curb further upside attempts.
Alternatively, bearish actions could send the pair lower towards the 50.0% Fibo of 0.6109. A violation of that zone could set the stage for the 38.2% Fibo of 0.6048, which held strong both in January and June. Sliding beneath that floor, the price may then test the 23.6% Fibo of 0.5972.
Overall, NZDUSD’s rebound seems to be gaining steam, while the break above the 200-day SMA has further improved the technical picture. Moving forward, a test of the June peak of 0.6220 might be the next turning point for the pair.