Technical Analysis – NZDUSD plunges to new multi-week low
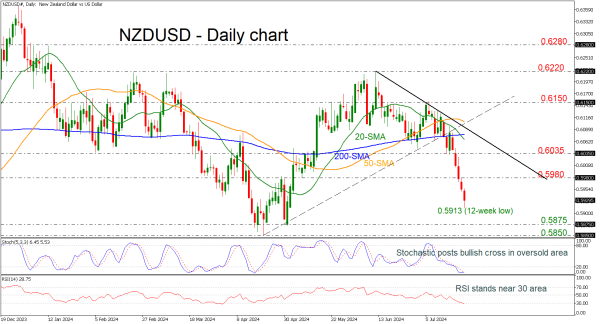
NZDUSD dives almost 4% from the July high of 0.6150
Price may rebound off 0.5875
20- and 200-day SMAs record a bearish cross
Momentum oscillators indicate upside correction
The 20- and 200-day simple moving averages (SMAs) established a negative crossover, confirming the recent negative move; however, the technical oscillators indicate an end to the bearish momentum. The stochastic posted a bullish cross within its %K and %D lines in the oversold area, while the RSI has slipped below the 30 level.
More downside pressures could push the bears towards the 0.5875 support level before testing the 0.5850 bar, which was achieved on April 19.
In the positive scenario, a rebound off the latest low could open the way towards the 0.5980 resistance, taken from the inside swing low on May 8, before challenging the 0.6035 resistance and the 200-day SMA at 0.6075.
All in all, the current picture in NZDUSD is bearish unless there is a significant climb back above the SMAs, the new downtrend line, and, more importantly, beyond the previous peak of 0.6220.