Technical Analysis of Intraday Price Movement of AUD/JPY Cross Currency Pairs, Wednesday August 21, 2024.
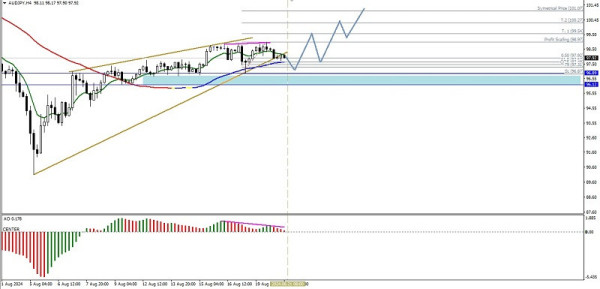
If we look at the 4-hour chart of the main currency pair AUD/JPY, there are two interesting things, namely the first is the appearance of a Rising Wedge pattern and the second is the deviation between the price movement of AUD/JPY which forms a Higher-High while on the contrary the Awesome Oscillator indicator forms a Higher-Low where both of these facts provide an indication of a weakening correction that will occur in the near future where the level of 97.31 will be tested in the near future but as long as AUD/JPY does not break below the level of 96.12 then AUD/JPY still has the potential to return to its initial bias where this is confirmed by the EMA 9 being above the MA 50 which indicates that Buyers still dominate in this market so that in the near future AUD/JPY has the potential to test the level of 98.97 if this level is broken above then the level of 100.27 will be the next target to be aimed at and if the momentum and volatility support then 101.07 will be the next target.
(Disclaimer)