Technical Analysis of Intraday Price Movement of BCH/USD Cryptocurrency, Friday August 23, 2024.
Last Updated
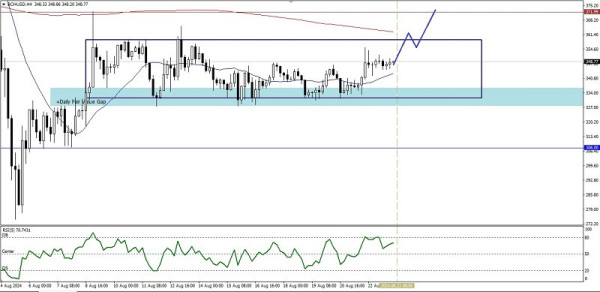
On the 4-hour chart, the BCH/USD cryptocurrency is seen moving in a ranging/sideways condition, which is clearly visible from its price movement between MA 20 and MA 200, but currently buyers have quietly started to enter, which is indicated by the RSI (5) indicator which is above level 50, so as long as there is no weakening that breaks below 308.00, BCH/USD has the potential to test and break through level 371.99 and if momentum and volatility support it, level 394.86 will be the next target to be targeted.
(Disclaimer)