Technical Analysis of Intraday Price Movement of Nasdaq 100 Index, Thursday August 29, 2024.
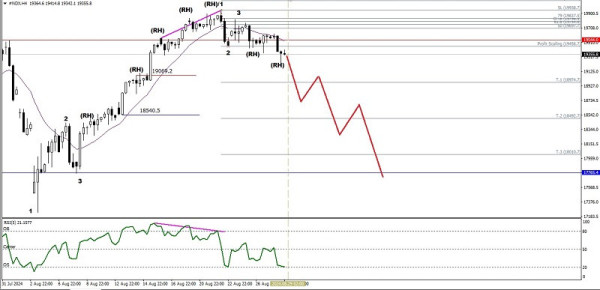
With the appearance of deviations between the Nasdaq 100 index price movement and the RSI indicator (55) on its 4-hour chart, in the near future #NDX has the potential to weaken, especially with confirmation by the appearance of the Bearish 123 pattern followed by several Bearish Ross Hook (RH) and its price movement moving below the WMA (20), then #NDX has the potential to test the level of 18974.7 in the near future if this level is successfully broken downwards then 18492.7 will be the next target to be targeted, even if the volatility and momentum of the weakening support it, then 18010.7 will be the next target to be targeted as long as on its way to these targets there is no strengthening to the initial bias, especially if it breaks above the level of 19837.5 because if this level is successfully broken upwards then all the weakening scenarios that have been described will become invalid and canceled by themselves.
(Disclaimer)