Technical Analysis – USDCAD still fights with 1.3600
USDCAD repeatedly tests the 200-day SMA
Momentum oscillators are mixed
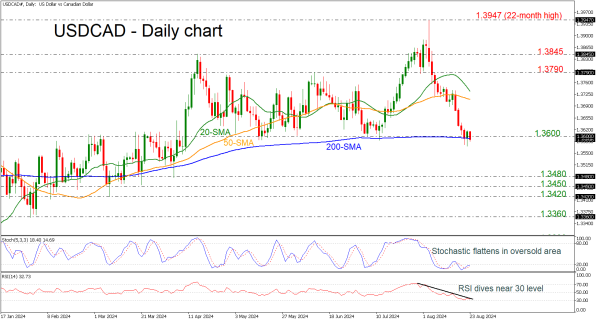
USDCAD has been battling with the 1.3600 round number and the 200-day simple moving average (SMA) over the last couple of days. A successful break beneath these critical levels could open the way for a downside retracement in the medium-term.
The technical oscillators are showing some contradictory signs. The stochastic is heading upwards after the bullish crossover within the %K and %D lines in the oversold area; however, the RSI is sloping down near the 30 level.
Steeper decreases could drive the bears to the 1.3480 support ahead of the 1.3450 barricade and 1.3420, taken from the lows between March and April.
A potential rebound off 1.3600 may increase optimism to traders increase optimism amongst traders, encouraging them to remain in a neutral-to-bullish mode, hitting the 50- and 20-day SMAs at 1.3710 and 1.3730, respectively. Moving up, the 1.3790 resistance may again act as a turning point.
All in all, USDCAD is hovering near key levels, and the next few sessions could clear up the market's next direction.