Technical Analysis – USDCHF bearish pressure lingers
USDCHF’s retreat continues with a new 6-month low recorded
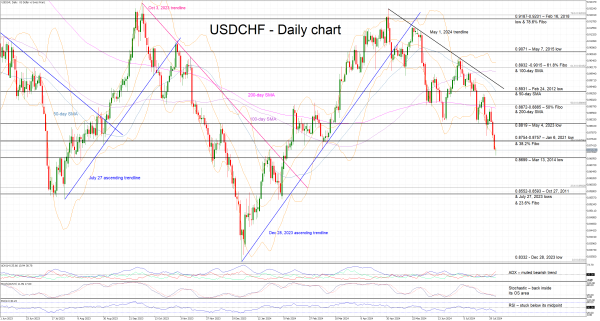
Downtrend from early May high is in place
Momentum indicators acknowledge the bearish pressure
Should the bears remain hungry, they could try to break below the March 13, 2014 low and then have a go at pushing USDCHF even lower. The 0.8552-0.8593 range, which is defined by the October 27, 2011 low, the July 27, 2023 low and the 23.6% Fibonacci retracement of the October 21, 2022 – July 27, 2023 downtrend, stands in bears' way to test the 2024 lows.
On the flip side, the bulls will probably try to defend the 0.8699 level and then gradually set course for the 0.8754-0.8757 area that is populated by the January 6, 2021 low and the 38.2% Fibonacci retracement. Even higher, they could test the resistance set by the busy 0.8872-0.8885 region, assuming they successfully surpass the May 4, 2023 low at 0.8819.
To sum up, the ongoing bearish pressure has pushed USDCHF to a new multi-month low with the bulls desperately trying to stage a comeback.