Technical Analysis – USDJPY edges lower near 2-month low
USDJPY holds beneath diagonal line
Stochastics and RSI suggest more bearish moves
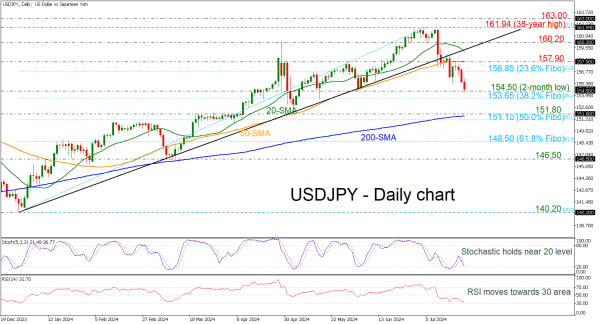
USDJPY tumbled to a new two-month low of 154.50 following a significant pullback from the long-term ascending trend line and the 50-day simple moving average (SMA) near 157.90. The stochastic oscillator created a bearish crossover, diving to just above the oversold region, while the RSI is also pointing downwards near the 30 level.
Further losses may drive the pair towards the 38.2% Fibonacci retracement level of the up leg from 140.20 to 161.94 at 153.65, before challenging the 200-day SMA around the 151.80 support. Slightly lower, the 50.0% Fibonacci of 151.10 may act as a turning point for traders.
On the other hand, a potential rebound off 154.50 could take investors higher again, resting near the 23.6% Fibonacci of 156.85 ahead of the 50-day SMA at 157.90. A climb back above the ascending trend line could endorse the scenario for bullish actions again, hitting 160.20.
In brief, USDJPY has been in a bearish correction since the climb to a 38-year high on July 3, and any closing sessions beneath the 200-day SMA could switch the long-term outlook to negative.