Technical Analysis – USDJPY hovers near 38.2% Fibonacci level

- USDJPY creates bullish correction from 14-month low
- RSI and MACD stand above their mid-levels
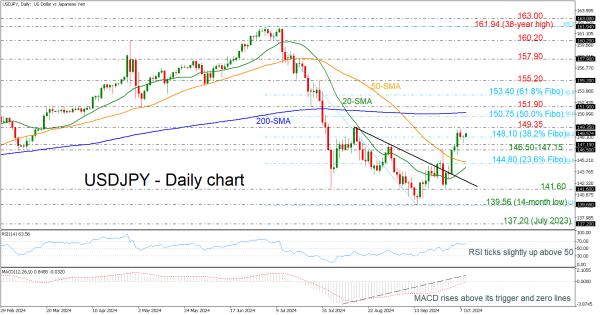
USDJPY is holding above the 38.2% Fibonacci retracement level of the down leg from 161.94 to 136.56 at 148.10 but is failing to extend its rebound from the 14-month low of 139.56 above the previous peak of 149.35.
Having a look at the technical oscillators, the RSI is pointing marginally up above the 50 area, while the MACD is strengthening its bullish momentum above its trigger and zero lines since it bottomed on August 8.
If the buying interest continues and the market surpasses the 149.35 resistance, then a strong obstacle could come from the 50.0% Fibonacci of 150.75 and the 200-day simple moving average (SMA) at 151.20.
In the negative scenario, a slide below the 38.2% Fibo of 148.10 could drive traders towards the immediate support of 146.50-147.15. Below that, the 50-day SMA and the 20-day SMA, where they stand near the 23.6% Fibonacci of 144.80, may pause the descending move.
Summarizing, USDJPY is displaying bullish attitude in the near term; however, only a break above the 200-day SMA could endorse the upside movement.