Technical Analysis – USDJPY's sideways trading might end abruptly
USDJPY continues to hover around the 146 area
Market participants are preparing for the US CPI release
Momentum indicators remain mixed
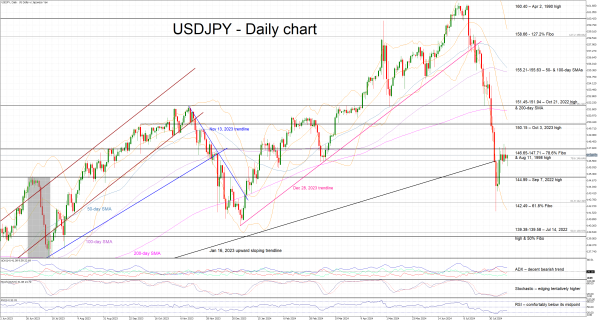
In the meantime, the momentum indicators are mixed. Specifically, despite the recent small upleg in USDJPY, the RSI remains below its midpoint and thus reveals a decent bearish pressure in USDJPY. Interestingly, the Average Directional Movement Index (ADX) continues to hover above its 25 threshold, pointing to a muted bearish trend in USDJPY. More importantly, the stochastic oscillator has managed to climb above its overbought area (OB), but it has probably run out of fuel as it is now trading sideways.
Should the bears remain confident, they could firstly try to push USDJPY below the 146.65-147.17 area, which is populated but the 78.6% Fibonacci retracement of the October 21, 2022 - January 16, 2023 downtrend and the August 11, 1998 high. They could then stage another sell-off towards the 144.99 level and gradually prepare for a retest of the 61.8% Fibonacci retracement at 142.49.
On the flip side, the bulls are desperately looking for another small upleg above the 146.65-147.71 area. They could lead USDJPY higher towards the October 3, 2023 high at 150.15, with the next plausible target being the busy 151.45-151.94 area.
To sum up, the relative calmness in USDJPY might not last as the market is preparing for some key US data releases.