Technical Analysis – Will AUDUSD continue its bullish wave trend?

AUDUSD holds in tight range near its recent high
RSI and MACD point down
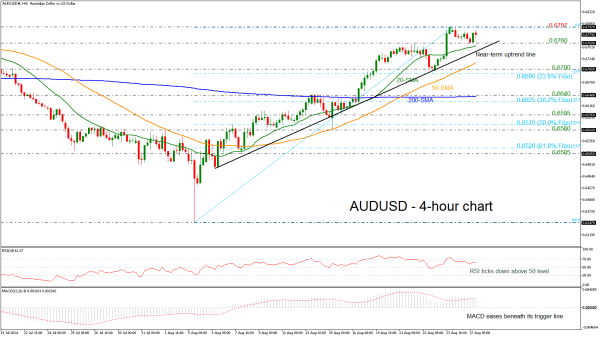
AUDUSD has been stuck within a range bound pattern in the near term defined by the 0.6794 and 0.6760 levels, although the price has been maintaining a bullish tendency since the beginning of August.
However, the technical oscillators suggest a potential downside retracement. The RSI is ticking lower above the neutral 50 level, while the MACD is sliding beneath its trigger line in the positive area.
If the price continues its recent rebound from 0.6760, the next resistance could come from the previous high of 0.6797 before resting near December's peak of 0.6870.
Alternatively, should the price reverse back lower, the 20-period simple moving average (SMA) at 0.6750 and the ascending trend line near 0.6740 could act as the first levels of defense. Further declines could then push the market towards the 50-period SMA at 0.6715, ahead of the 0.6700–0.6690 region, which encapsulates the 23.6% Fibonacci retracement level of the upward move from 0.6347 to 0.6797.
In brief, AUDUSD looks positive as long as it stands above the uptrend line and the 200-period SMA in the 4-hour chart.