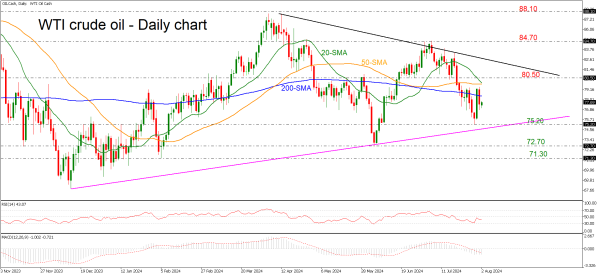
Technical Analysis – WTI crude oil hovers beneath 200-day SMA

WTI trades within symmetrical triangle
20- and 50-day SMAs are ready for bearish cross
WTI crude oil is moving back and forth from the 200-day simple moving average (SMA), with a strong resistance area near the potential bearish crossover between the 20- and 50-day SMAs. The price is developing within a symmetrical triangle in the medium-term timeframe, with no clear directional movement for now.
According to technical oscillators, the RSI is sloping slightly up beneath the neutral threshold of 50, while the MACD is trying to regain some momentum, but it remains below its trigger and zero lines.
If the market successfully surpasses the 200-day SMA, then it may head towards the next short-term SMAs near 79.90, ahead of the 80.50 resistance level. Even higher, the descending trend line from April 12 at 82.30 may halt bullish actions.
On the other hand, a slide to the downside could meet immediate support at 75.20 before penetrating the longer-term uptrend line and visiting the 72.70 and 71.30 support levels.
In summary, oil prices do not have a clear picture, and only a break above or below the diagonal lines could endorse the next tendency.