Technical Update - 5% correction in Copper? Medium-term outlook remains bullish
- Copper top and reversal pattern indciaign a correction down to around 420-419 before uptrend could resume. Medium-term outlook still bullish
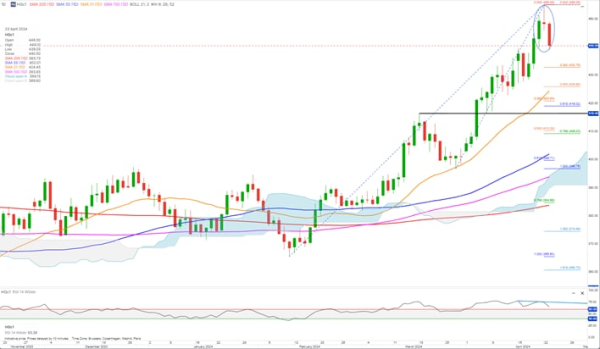
Copper has formed a Doji Evening-like top and reversal pattern (circled — not textbook perfect, but nevertheless) and appears poised for a correction.
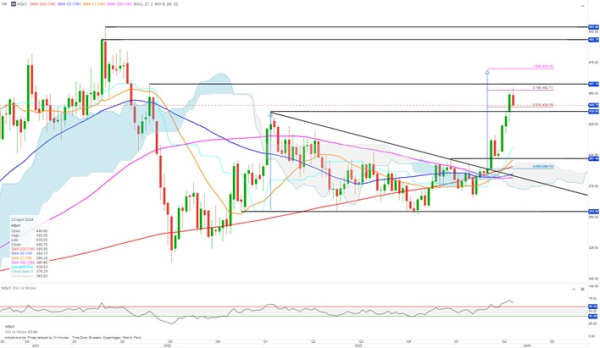
The top and reversal occur after copper almost reached the minor resistance at around 457.70, as seen on the weekly chart.
The strength indicator, RSI, is showing divergence with RSI values declining while copper prices have been rising, suggesting trend exhaustion.
The medium-term weekly chart demonstrates how copper has reached the Fibonacci 0.786 level of the descending triangle-like pattern, marked by two vertical arrows. just below the 457.70 peak
Medium-term, the trend remains intact with no RSI divergence, indicating that copper is likely to trade higher in the coming weeks or months after a probable correction.
A correction could potentially bring copper down to the 420-419 range, which corresponds to the 0.382 and 0.618 Fibonacci retracements of the entire uptrend since February and the last leg up since the end of March, respectively. Just above strong support at around 416.40.
To negate this top and reversal scenario, a daily close above 455 is necessary. If this occurs, copper could advance higher towards the March 2022 high close - peak at around 493.75 - 503.95