Technical Update - Apple, Nvidia and Super Micro Computer could be resuming uptrends
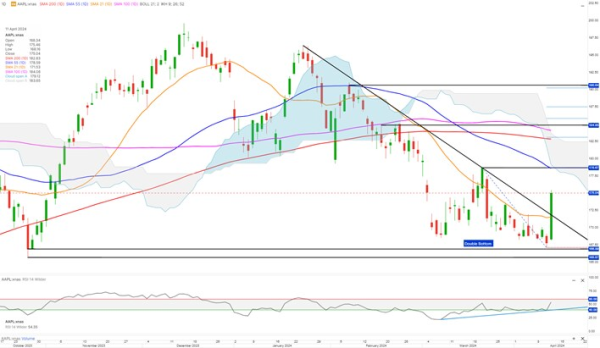
- Apple bounced from strong support area and could test key resistance at 178.67. A daily close above could push Apple towards 190
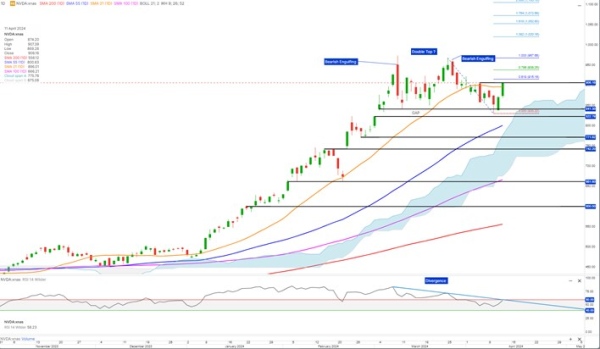
- Nvidia bounced from strong support area. Could challenge top and reversal patterns and all-time highs. But will it? Key support at 822.79
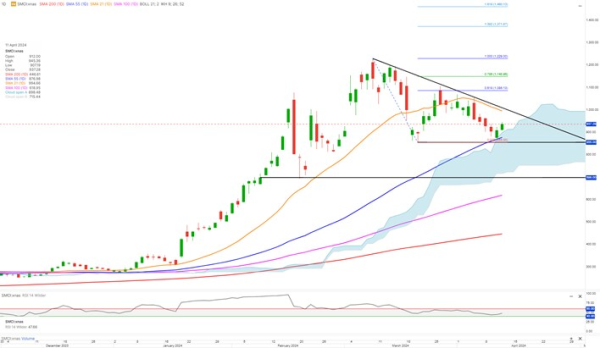
- Super Micro Computer SMCI forming corrective pattern. Bullish break out could push to new all-time highs above 1,229. Key support at 855
Apple bounced strongly yesterday from support around 166.89 to close above its upper falling trendline. There is short-term potential up to strong resistance at around 178.67.
A daily close above this level could lay the foundation for further gains and confirm a double bottom pattern with potential up to around 190.
The RSI has been indicating trend exhaustion with higher values while Apple share price was declining but if RSI closes above the 60 threshold, the bullish scenario will be confirmed.
However, there is strong overhead resistance at around 184.85, and the 55, 100, and 200 daily Moving Averages are declining, indicating underlying bearish sentiment and trend.
If Apple is rejected at 178.67, the bearish trend is likely to resume.
On the medium-term weekly chart, the double top pattern is still in play, although not yet confirmed. A close below 165.67 is needed for confirmation, while a weekly close above 179.66 could demolish the double top pattern, confirming a return to a bullish medium-term trend.
Had it closed below 822.79, the double top pattern would have been confirmed, potentially leading to a sell-off down to around 771-742.
Now, Nvidia appears to be resuming its uptrend. A daily close above 806.34 – just a few cents off yesterday – is likely to push the stock towards all-time highs.
However, a close above 974 is needed to cancel the two bearish engulfing top and reversal patterns as indicated on the chart.
If RSI closes above its upper falling trendline and the 60 threshold, it will reinforce the bullish scenario with potential for Apple to challenge all-time highs.
If the bullish scenario plays out, Nvidia could have short-term potential to 1,052, i.e., the 1.618 projection. The key strong support is at 822.79. A close below will confirm the bearish scenario
Super Micro Computer (SMCI) is in the process of forming a descending triangle-like pattern. Key support is at 855.
A close above the upper falling trendline is likely to push SMCI to test the 0.618 retracement and resistance at around 1,086.
A daily close above could give buyers the energy to lift the share price to new all-time highs. Short-term to the 1.382 projection at 1,371, but potentially up to the 1.618 projection at 1,460 would be in the cards.
A daily close below 855 will result in a bearish breakout of the triangle with support at 698 likely to be reached.