Technical Update - Bullish Gold Eyeing 2,500. Reversal Indications in Silver and Copper, Rebounds Likely
- Gold seems to be resuming its bullish trend after a sideways correction and could push to 2,500 and higher
- Silver has formed a bottom and reversal pattern, with rebound potential to 29
- Copper's downtrend seems to have exhausted. A rebound to 422, possibly 440, is in the cards
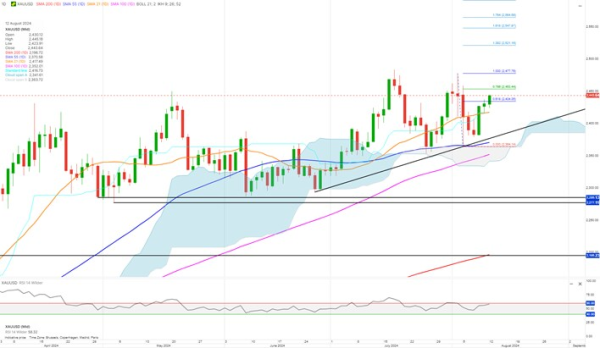
Gold bullish trend is intact after a sideways correction. The precious metal is currently breaking above the 0.618 retracement at 2,434 and if closing above this level, Gold could test its previous peak and all-time high, possibly reaching +2,500.
Gold failed earlier this month to break higher, but this time it could succeed. RSI is showing positive sentiment, and if it closes back above 60, it will further confirm the bullish outlook for Gold.
Gold needs to close below 2,360 to reverse the bullish trend.
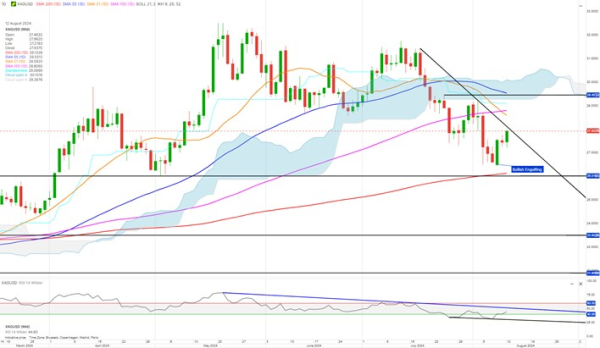
Silver formed a bullish engulfing bottom and reversal pattern last Thursday.
When I see an engulfing candle on FX spot, I am a bit skeptical, so I always check with the futures market.
And, for Silver, there is also a bullish engulfing candle formed on the future, making the pattern more reliable.
So, despite RSI not showing divergence, Silver could rebound to around 29. A break above the upper falling trendline is likely to be the first indication of Silver reversing its bearish trend.
However, a daily close above 29.45 is needed for Silver to establish a bullish trend.
A daily close below 26.40 will demolish the bullish reversal, extending the bearish move.
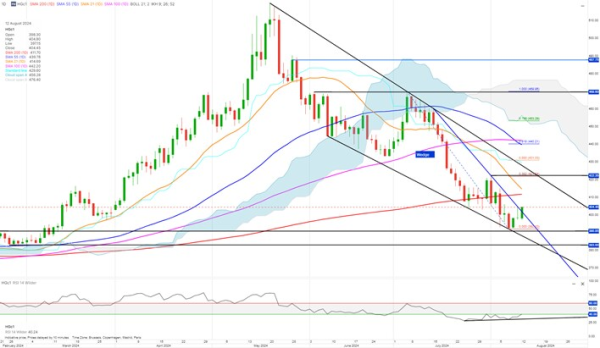
Copper now seems to be breaking out of the falling wedge pattern. A daily close above the short-term falling (blue) trendline will confirm the breakout, with short-term rebound potential to the 0.382 retracement and resistance around 422.
A close above this level could push Copper up to the 0.618 retracement at 440.20.
After a falling wedge breakout, an instrument should be able to move to the 0.618 retracement as a minimum. However, the falling 55 and 100 daily moving averages do provide overhead resistance.
RSI has shown divergence (RSI values have risen while Copper was declining), indicating trend exhaustion and supporting the rebound scenario.
A daily close below 392 will demolish the wedge reversal picture and likely send Copper down to the support at around 383.