Technical Update - EURCHF and USDCHF uptrends running out of steam. Find the key levels here
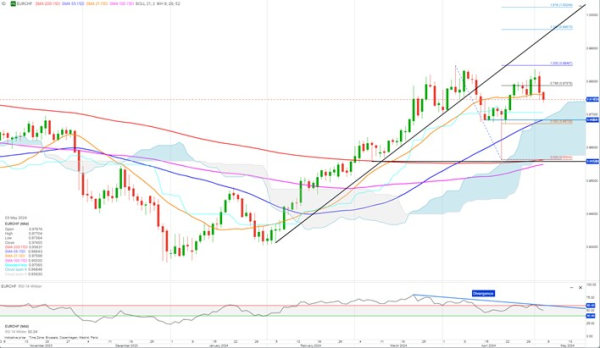
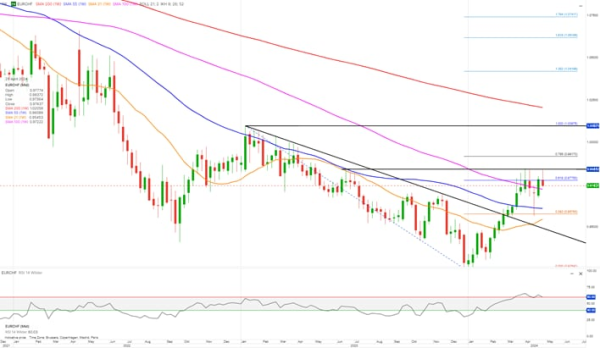
EURCHF has lost steam just below the April peak at around 0.9840-0.9850. That level seems too strong for EURCHF to penetrate. The level stems back from June 2023 as can be seen on the weekly chart.
Key question is are we going to see another setback in EURCHF?
On the daily chart the price movement has formed a double top like pattern. It is not yet confirmed though. A daily close below 0.9564 is required.
However, that is quite a far distance away but if we are only taking closing prices in to account a break below 0.9684 will be a very good indication of EURCHF double top pattern is to unfold. A sell off down to the dip in April at 0.9543 could be seen.
The strength indicator RSI is showing divergence suggesting a bearish correction from current levels is likely.
For EURCHF to extend the uptrend a daily close above 0.9850 is required. That would likely lead to a push to 0.9917-1.00
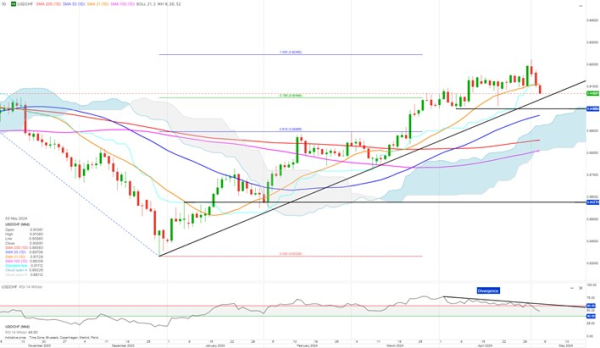
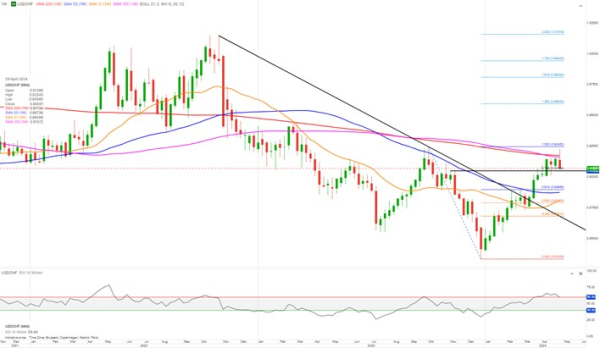
USDCHF uptrend lost momentum just a few pips below October 2023 peak at 0.9245.
The RSI has been showing divergence during the April bullish move indicating trend exhaustion.
If USDCHF is breaking below its lower rising trendline the key support at around 0.90 is very likely to be tested.
A daily close below 0.90 is likely to push USDCHF down to 0.89
For USDCHF to resume and extend its current bullish trend short-term, a daily close above 0.92 is required.