Technical Update - EURUSD and GBPUSD correction unfolding - but how deep?
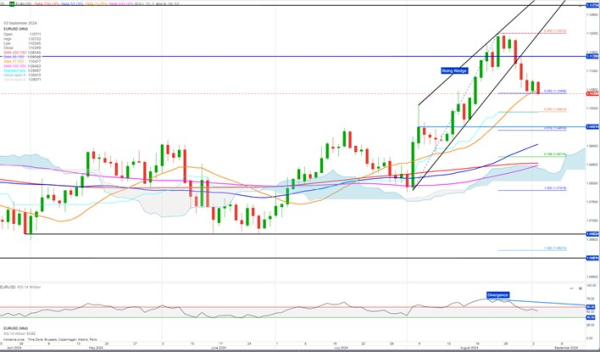
EURUSD is breaking below the minor support at the 0.382 retracement at 1.1040 and could face a bearish move down to the strong support and 0.618 retracement at around 1.0950–1.0940.
The correction comes after RSI signaled bullish trend exhaustion in the form of divergence (where the RSI values were declining while EURUSD was still rising).
There is minor support at around 1.0980.
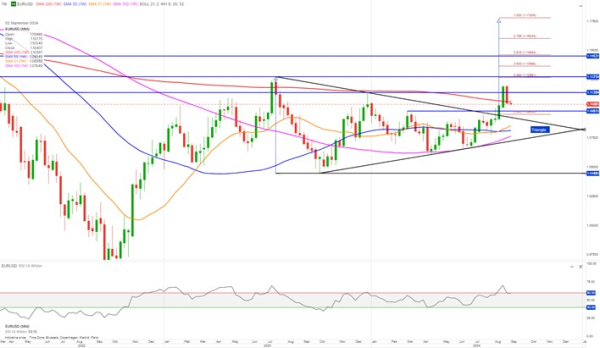
Medium-Term Weekly Chart:
A couple of weeks ago, EURUSD broke bullish out of the symmetrical triangle-like pattern and reached 1.12 before retracing.
However, EURUSD has established a bullish trend (higher highs and higher lows) with upside potential to 1.1450.
The weekly RSI is showing positive sentiment, supporting the bullish move. The current setback is likely just a correction, which is not unusual after a triangle breakout.
The key question is how deep the correction will be. For a reversal of the bullish trend, a daily close below 1.0880 is required.
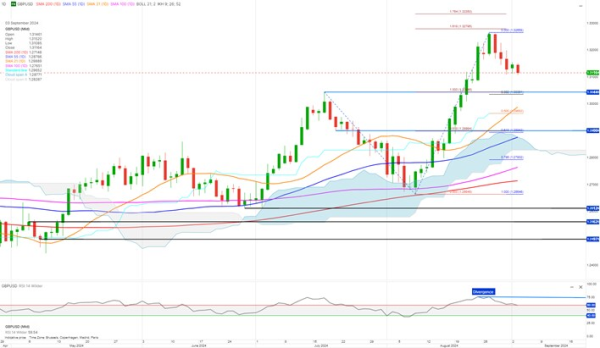
GBPUSD correction seems to be unfolding with short-term potential down to the support and 0.382 retracement at 1.3045–1.3035.
The correction comes after RSI signaled bullish trend exhaustion in the form of divergence (where the RSI values were declining while GBPUSD was still rising).
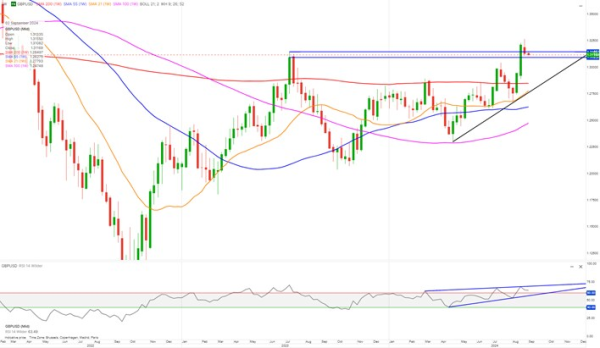
Medium-Term Weekly Chart:
GBPUSD closed above the strong resistance at around 1.3145, further confirming the bullish trend, meaning the correction is likely to be limited.
If it closes below 1.3030, the correction could, however, extend down to 1.29.
A break back above 1.3265 would see the bullish trend resume with upside potential to 1.3425.