Technical Update - Intel, Arm and Amazon in heavy sell-offs. Apple holding on - for now
Chip maker Intel released earnings after market close yesterday that disappointed the market. Shares were down 17% in after-market trading. That was after dropping 5.50% in the ordinary trading session.
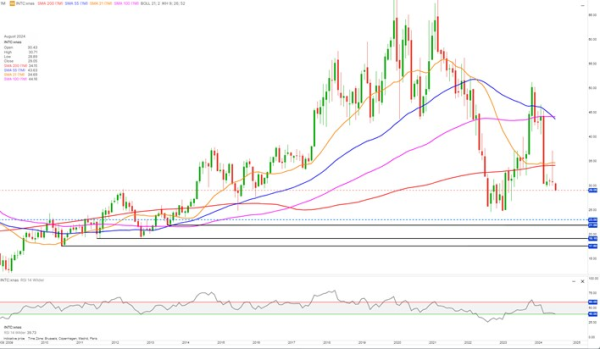
Intel is estimated to open around 23.00, a price not seen since 2014! See the dashed blue line on the monthly chart.
Bargain hunters could try lifting the share during the session, but it could be like catching a falling knife. The share price could very well drop further. There is not any strong support until around 19.16, a level not seen since 2012! If that level does not hold, the next one is at around 17.60. Minor support at around 21.89.
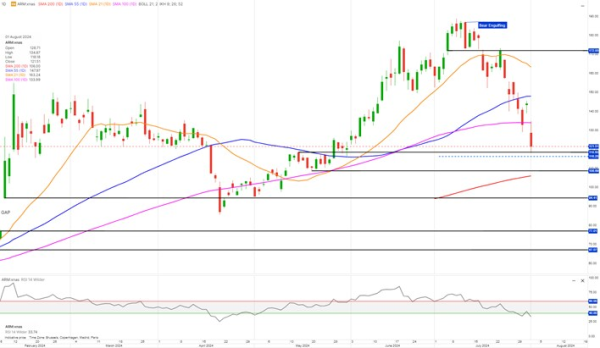
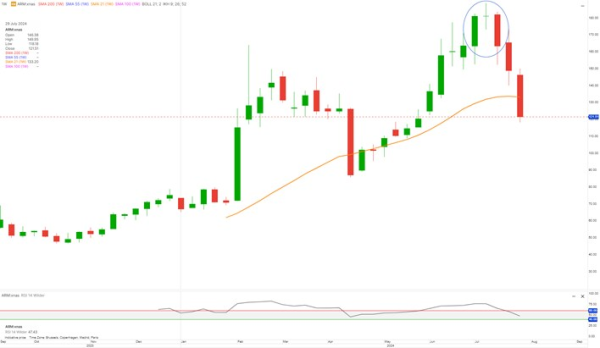
Minor support at 108.69, where the 200 daily moving average also will give some support. But a sell-off down to support at around 94.40 could be seen over the next couple of weeks.
The strength indicator RSI is showing negative sentiment, indicating likely lower Arm levels.
A daily close above 145.50 will short-term demolish the bearish trend.
However, the weekly chart has formed a Doji evening top and reversal pattern (cirlced) strong indicating lower levels
For more analysis on semiconductors, see this video: Cramers Corner Technical Update Global Equities
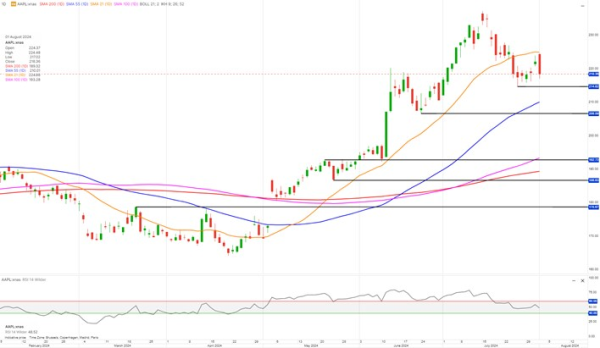
Apple opened yesterday higher but got hit by selling that lasted throughout the trading session, thereby forming a bearish engulfing candle. That comes after a top and reversal pattern formed mid-July. Apple is set to open unchanged, but if closing below 214.60, it would confirm its downtrend in the short term.
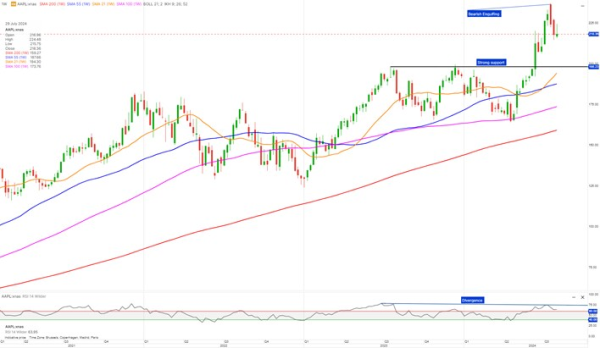
On the weekly chart, Apple has formed a bearish engulfing top and reversal pattern. Combined with divergence on the strength indicator RSI (RSI values have been declining while share prices have been climbing), the bullish trend is in exhaustion mode and could very well be over.
A close below 206.59 will further confirm the medium-term bearish trend with short-to medium-term potential to the strong support around 198.25, but could drop further to the 192–187 area.
To reverse this potential bearish picture short-term, a daily close above yesterday’s peak at 224.50 is required. If that scenario plays out, there would be potential to challenge the all-time highs recorded last month.
Daily RSI is still showing positive sentiment, and a close above 60 will be a good indication that Apple will resume its uptrend and possibly reach new all-time highs. An RSI close below 40 will confirm the bearish trend.
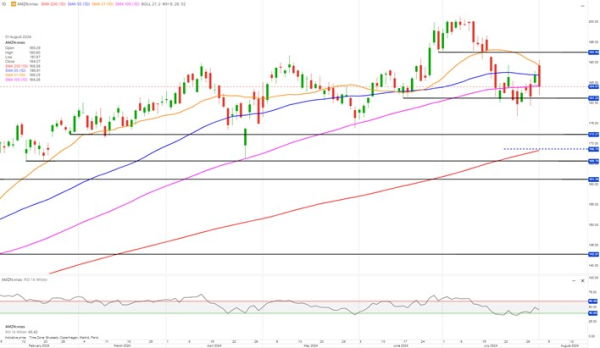
A daily close below 165.75 could send Amazon lower to around 161–160.
The strength indicator RSI is showing negative sentiment, indicating lower share prices are likely.
A daily close above 172.30 could give a short relief rally short-term, demolishing the bearish trend.
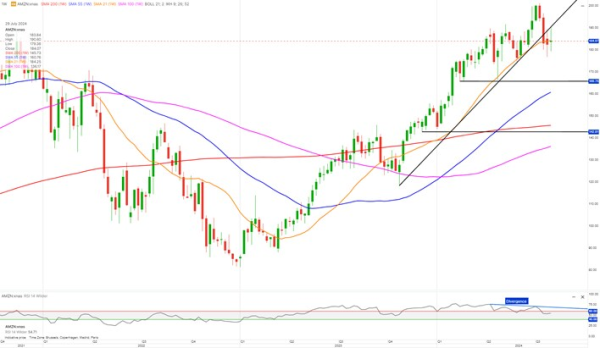
Medium-term, the weekly chart shows Amazon has closed below its rising trendline. Combined with RSI divergence (RSI values have been declining while share prices have been climbing), it is an indication of uptrend exhaustion.