Technical Update - Intel's Struggle: Will the downtrend continue towards 2009 lows - or could it enjoy a rebound?
Intel – the bigger picture
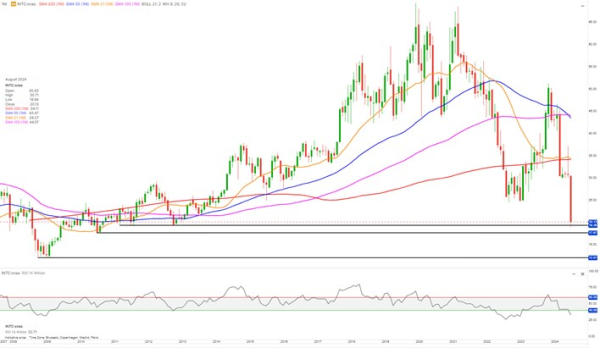
Once, Intel was the semiconductor manufacturer the whole market was watching. That was back in the .com era and before Nvidia started dominating. Now, Intel is in trouble. The share price has lost more than 60% since the beginning of this year and is back to 2012 levels – see monthly chart.
Short-term
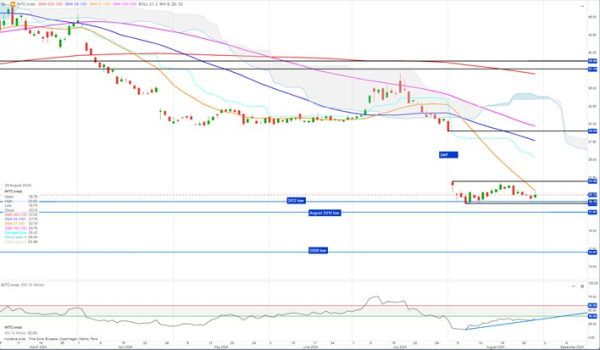
After the most recent sell-off on 2nd August, Intel has been trading in a narrow range between 22.00 and 18.90 and needs to break out for direction in the short term.
A daily close above 22.00 could lead to a short rally where Intel will try to close the gap up to 29.05. Whether it will succeed in closing the gap will depend on the behaviour of the strength indicator RSI; an RSI close above the 60 threshold will support a bullish move towards the upper border of the gap.
However, during the recent sell-off and new low, RSI did not indicate divergence, i.e., has not indicated that the downtrend in the share price has exhausted. Lower levels could occur
If Intel breaks below 18.90, the August 2010 trough at around 17.67 is likely to be tested. Closing below 17.67 could further spur a sell-off, and the 2009 low around 12.07 reached.
The first indication of the continued bearish scenario playing out would be if RSI closes below its rising (blue) trendline. That, however, will not guarantee Intel is dropping all the way down to the 2009 low around 12.07. Buyers/bottom fishers could jump in lifting the share price before it hits USD12. Keep an eye out for a bottom and reversal pattern emerging