Technical Update - JPY pairs: Indicators indecisive about the direction
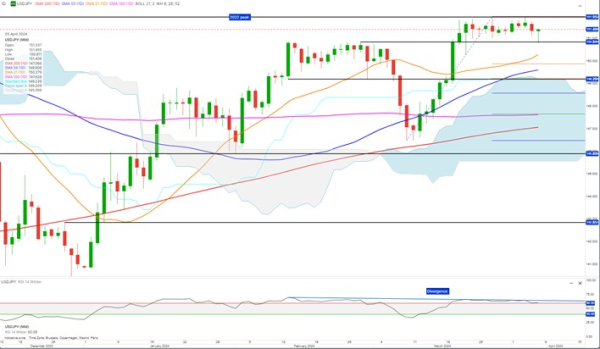
- USDJPY is caught range-bound in a tight range between 151.95 and 150.84
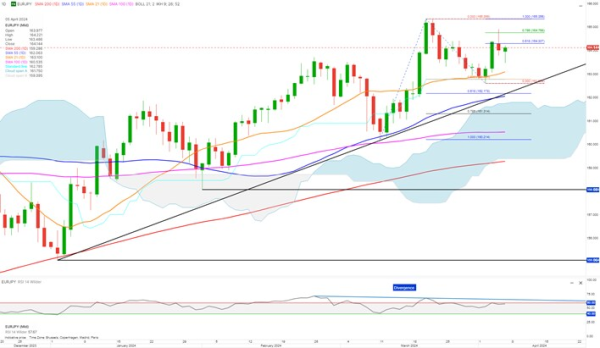
- EURJPY rejected at retracement level just below 165. Expect pair being hit by high volatility
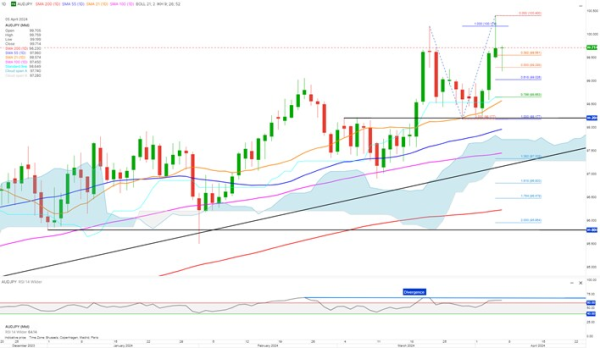
- AUDJPY failed to close above previous peak. Could slide back to test key support at 98.20
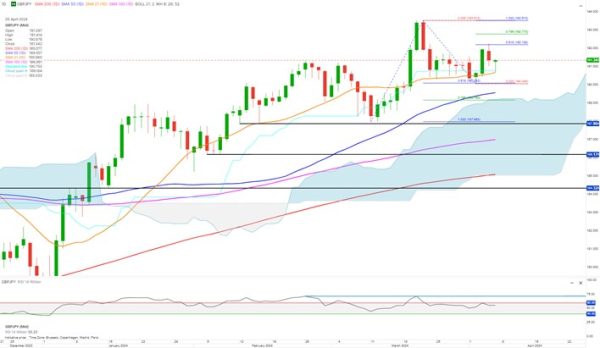
- GBPJPY bouncing around between 0.786 Fibonacci retracement levels. What is the direction?
USDJPY is caught range-bound in a tight range between 151.95 and 150.84. A daily close above or below these levels is necessary to indicate the next direction.
A close above 151.95 suggests short-term upside potential to the 1.618 projection at 153.60. Conversely, a close below 150.84 indicates that a correction down to support at around 149.20 is quite likely, potentially extending down to the 0.618 retracement at 148.58.
While the RSI is indecisive, this strength indicator is showing positive sentiment, indicating potential for higher USDJPY values. However, RSI is also exhibiting divergence—RSI values are declining while USDJPY have moved higher—suggesting that the bullish push to test 151.95 could be nearing exhaustion, and a correction may be unfolding shortly
Last week's low at 162.60 and the lower rising trendline could be tested. If breaking below that level the 0.786 retracement at 161.31 is likely to be reached.
A push above yesterday's peak at 164.92 is likely to also take out the previous peak at 165.35.
RSI is showing divergence, indicating that EURJPY is most likely to drop lower. On the other hand, the moving averages are all rising, indicating underlying bullish sentiment
The pair could retrace back to test the key strong support at around 98.20 once again.
The RSI divergence is indicating AUDJPY is likely to see taht scenario to play out.
However, a likely scenario for AUDJPY is range-bound trading between 100 and 98.20. A breakout is needed for medium-term trend direction
That is the range GBP/JPY needs to break out of for direction.
A bearish break, i.e., a break below 190, could lead to a move to the 0.786 retracement at 189.15, possibly extending all the way down to key strong support at around 187.90.
Conversely, a bullish breakout, i.e., a break above 192.19, could see the previous peak at 193.51 being tested.
RSI is showing positive sentiment with no divergence, suggesting a bullish breakout for GBPJPY