Technical Update - Nikkei and JP225 could be hit by another round of selling to levels below 30,000
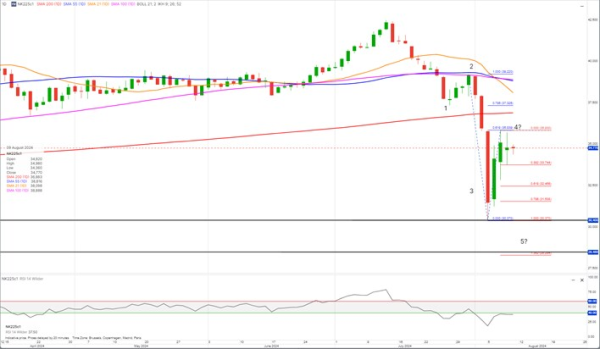
The Nikkei future has bounced strongly after the sell-off that hit late last week and Monday this week.
A bounce to the 0.618 retracement of the sell-off to 35,847 has occurred (blue Fibonacci levels). That could be the corrective 4th wave in an Elliott Wave pattern (see explanation at the end of the article) that is concluded.
If that is the case, then the 5th exhaustive wave is just around the corner. A 5th wave could take the Nikkei down to the 1.382 projection of the 4th wave at 28,264, which is also where there is some support, but it could extend to the 1.618 projection at 26,996, just above the support at around 26,430 (red Fibonacci levels).
However, if the Nikkei breaks above 35,847, the rebound could continue to the 0.786 retracement at 37,326. A move below 33,740 is likely the first indication of the continued bearish scenario playing out.
RSI is showing negative sentiment and seems to be rejected at the 40 threshold. If RSI cannot close above the 40 level, the Nikkei is likely to test the 30,400 low from Monday and most likely take it out.
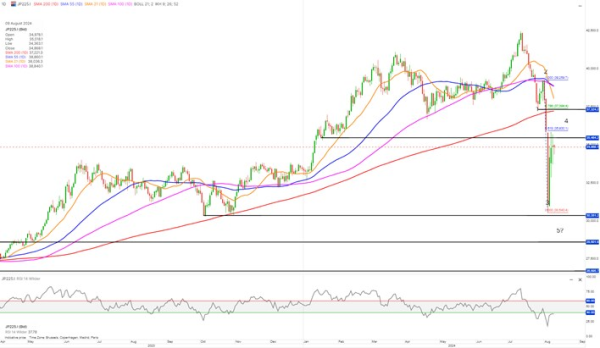
The weekly chart shows how significant the 30,400 support is.
A close below this level would indicate the next support at around 28,480 and around 26,430–25,780 could be reached.
For this bearish trend – regardless of whether the 5th wave pattern is unfolding – a close above 39,220 is required to demolish it.

JP225 cfd levels:
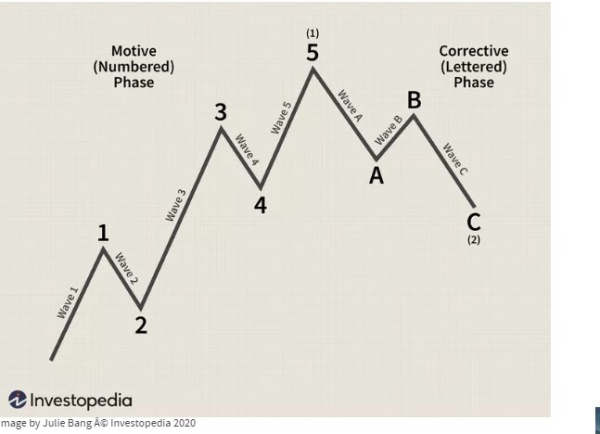
Elliott Wave theory: (from Investopedia) The Elliott Wave Theory in technical analysis describes price movements in the financial market. Developed by Ralph Nelson Elliott, it observes recurring fractal wave patterns identified in stock price movements and consumer behavior
In short it consists of five waves in an up or down trend followed by three corrective waves with the following rules:
- Wave 2 cannot retrace more than the beginning of Wave 1
- Wave 3 cannot be the shortest wave of the three impulse waves, 1, 3, and 5
- Wave 4 does not overlap with the price territory of Wave 1
- Wave 5 needs to end with momentum divergence (e.g. RSI)
There are rules for the corrective waves as well.
Fibonacci Retracements and Projections/Extensions can be applied to find retracement and target levels