Technical Update - Nvidia, ARM and Super Micro below key supports. Selling pressure likely to continue
AI related semiconductors hit by heavy selling after breaking key support levels.
Nvidia below 822 key support at 822 could see further down side to 700, possibly lower.
ARM Holdings no strong support until around USD 77
Super Micro Computer eyeing 600, but no strong support until around 492
Bullish correction should be expected but be careful, you could be trying to catch a falling knife
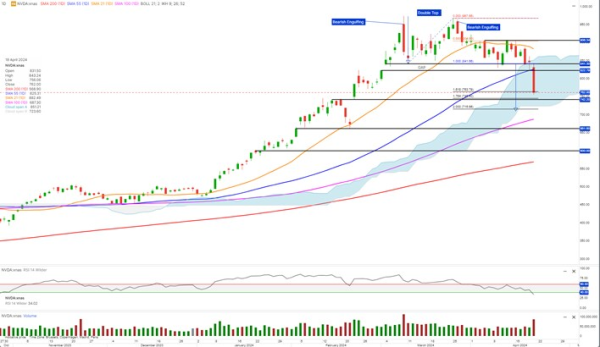
Nvidia. After testing key supports — the gap area — a few times, it finally gave in on Friday. Nvidia was hit by a massive sell-off on Friday, down 10%.
This comes after Nvidia formed two Bearish Engulfing candlesticks, which are strong indications of a top and reversal, and created a double top pattern in the process. The double top was confirmed
On Friday, Nvidia sold off to the 1.618 projection of the double top pattern but could push lower in the coming days.
A bearish move to support at around 742 seems likely.
A daily close below 742 could ignite another wave of selling down below 700, with no strong support until around 661.60. If Nvidia closes below the Cloud area (the shaded area), it will add to the bearish picture.
The RSI closed on Friday below the 40 threshold, further confirming the bearish trend indicating lower levels for Nvidia.
To negate this bearish picture, a daily close above 841 is required.
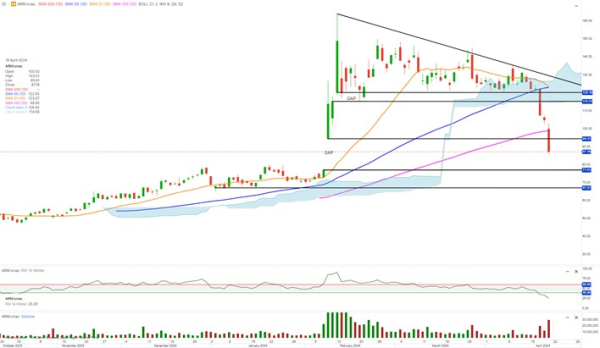
In this case it has become a reversal pattern after closing below 120.
The selling has continued to push ARM below the upper boundary of the big gap area from February. There is now no strong support until at around USD 77.
ARM is trading below all daily moving average and RSI is showing negative sentiment with no divergence indicating lower levels for ARM are likely in coming days/weeks
Short-term rebounds could be seen but to negate this bearish picture a daily close above 115.20 is minimum requirement
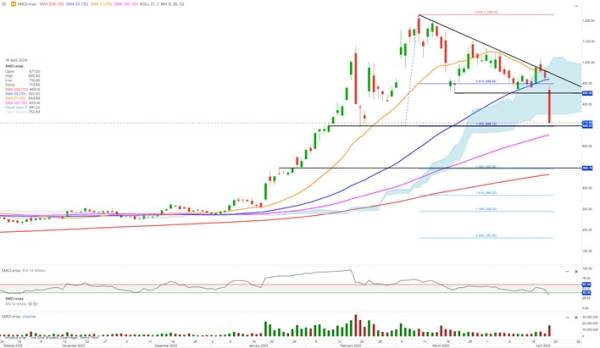
SMCI closed Friday below the Cloud area (shaded area) which is a strong indicating of SMCI in bearish trend, and the RSI below the 40 threshold, confirming the downtrend that is likely to see lower levels.
A daily close below 698 could push SMCI down to around 600, where the 100 daily moving average will offer some support.
However, a bearish move down to the 1.382 projection of the top and reversal-like pattern (it resembles a Shoulder-Head-Shoulder pattern) at around 492.59, close to where the 200 daily moving average is currently moving, could be seen over the next couple of weeks.
However, some bullish corrections should be expected, but to negate the bearish picture, a daily close above 1,000 is the minimum requirement.
Disclaimer: Author of this analysis is short position in ARM