Technical Update - Nvidia’s bullish trend in jeopardy after earnings – Key levels to watch!
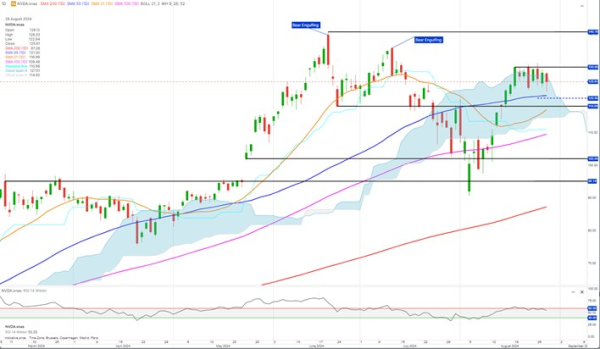
Nvidia released its Q2 earnings after-market yesterday. The report was not well received, and the share price dropped 4% in extended trading, meaning Nvidia lost a total of 6% yesterday to close at 120.50 (illustrated by the dashed blue line). Pre-market Nvidia is also trading around that level
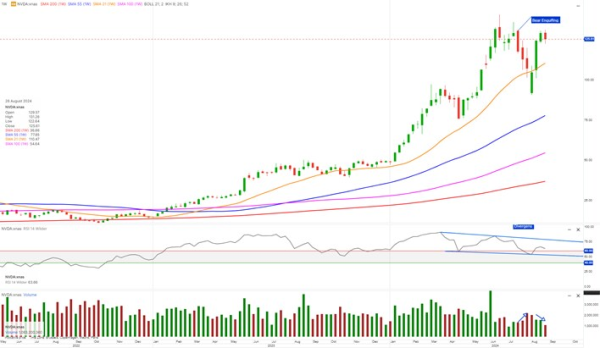
The two bearish engulfing candles in June and July, respectively, are still intact, and the bearish engulfing candle on the weekly chart is also still intact, suggesting that the bullish trend in Nvidia has quite likely come to an end both short- and medium-term.
(A Bearish Engulfing candle occurs when the market price opens higher than the previous day’s closing price and closes lower than the previous day’s opening price. It illustrates that the sellers have taken control, and there is a great likelihood they will keep that control, i.e., keep selling until buyers take back control.)
If Nvidia closes below 118, the selling pressure could intensify, pushing the share price back down to the August lows around 100–90.
Medium-term, the weekly chart shows how the traded volume of shares has been higher on down days than on up days, illustrated by the rising and falling arrows on the chart. That is a sign of fewer buyers lifting the share price, indicating divergence or imbalance in the market.
The strength indicator, RSI, tells the same story. The RSI values are declining while Nvidia’s share price is rising. This is called divergence or imbalance and is an indication of trend exhaustion.
To reverse the top and reversal picture, Nvidia must make a new high, and both RSI and Volume must rise when the share price is rising. A daily close above 130 will be the first indication of that scenario playing out