Technical Update - Rebound in US stock indices turns into established uptrends. Could challenge all-time highs
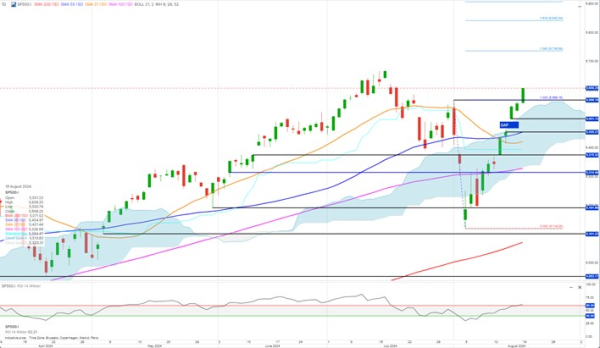
- The rebound in the S&P 500 / US500 cfd is complete. Bullish trend confirmed
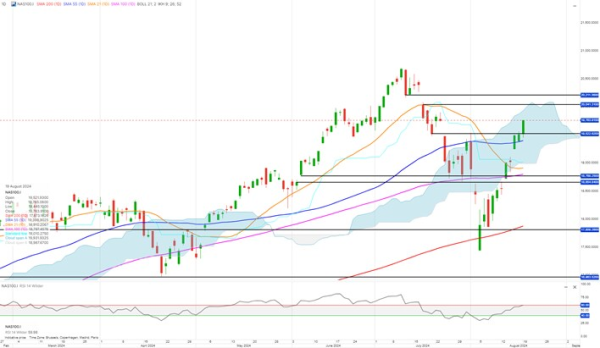
- Nasdaq 100/USNAS100 cfd lagging with strength indicator still showing negative sentiment
The leading US index S&P 500 is back to where it was prior to the massive sell-off in the first few trading days of August.
Yesterday, the S&P 500 closed above the resistance at around 5,566, and more importantly for future potential upside, the strength indicator RSI closed above the 60 threshold, i.e., now showing positive sentiment supporting higher index levels.
S&P 500 could challenge the all-time high at around 5,570, shortly A close above could give further energy to 5,736, possibly up to the 5,842 area.
A bearish close of the gap, i.e., a close below 5,455, will demolish the bullish picture.
Nasdaq 100 closed yesterday above key resistance at around 19,523, establishing a bullish trend that has potential for higher levels.
But, contrary to the S&P 500, the RSI has not yet closed above the 60 threshold but is expected to do so in a day or two, thereby further supporting the bullish picture.
The next resistance for the Nasdaq 100 is the gap area 20,041–20,211.
A close above is likely to lead to new all-time highs.
A rejection could lead to a correction to test the now-support at around 19,523.