Technical Update - SP 500 and Nasdaq 100 uptrend exhaustion or extension? Check out the key levels here
S&P 500 has closed the gap created 13th February on the back of the CPI data release.
But the Index still need to close above the peak from the day before i.e., closing above 5,049 to extend the uptrend
RSI is still showing divergence i.e., indicating Index trend exhaustion but an RSI close above the upper falling trendline can be a strong indication of the bullish trend to be extended
If S&P 500 is closing below 4,920 combined with RSI closing below the 60 threshold a larger correction or even a trend reversal could unfold.
Key strong support at around 4,845 and 4,793
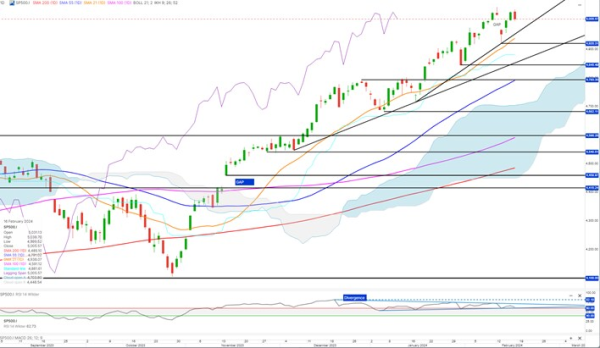
US500 cfd levels: Bullish trend but RSI divergence indicating trend exhaustion . A break below 4,919 could be fuel a sell-off down to key support at around 4,841 possibly down to 4,793
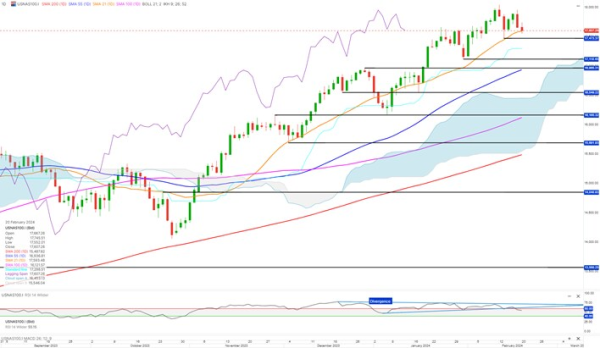
Nasdaq 100 hasn’t closed the gap created 13th February. A close above 17,883 is needed to do just that. A close above is needed for Nasdaq to push for a trend extension.
A bullish trend that is stretched and as indicated by divergence on RSI in exhaustion mode.
If Nasdaq 100 is closing below 17,478 a correction is likely unfolding. A correction that could take the Index down to 17,128-16,963
If Nasdaq 100 is closing the gap the peak from last week could be tested. It needs to be taken out by a daily close i.e., a close above 18,042 for the Index to resume and extend the uptrend
USNAS100 cfd levels: A break below 17,473 could fuel a sell-off down to around 17,118-16,965.
A break above 17,959 would indicate uptrend is likely to be extended