Technical Update - SP500 and Dow Jones in bearish trends. Nasdaq 100 holding on above key support
- S&P 500/US500 and Dow Jones/US30 confirmed bearish trend
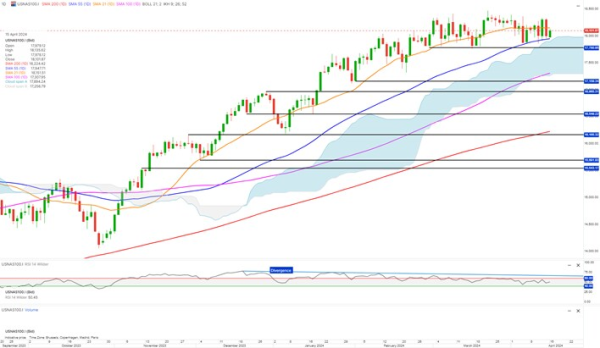
- Nasdaq 100/USNAS100 still holding on above key support
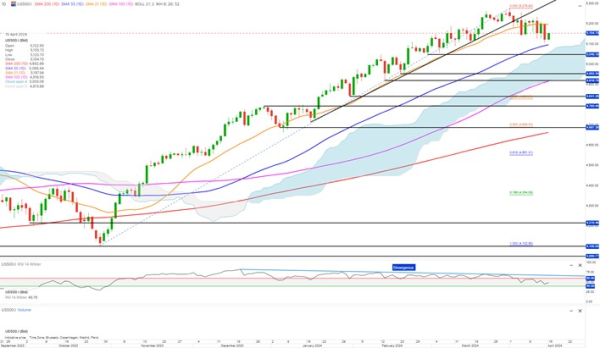
S&P 500 closed Friday below minor support at 5,146 thus confirming the bearish trend. A bearish move to the strong support at around 5,057 is likely.
The strength indicator RSI has been indicating uptrend exhaustion for quite some time and if it is closing below 40 threshold there is downside potential for S&P 500 to around 4,953 short- to medium-term
For S&P 500 to reverse this bearish picture a daily close above 5,265 is required
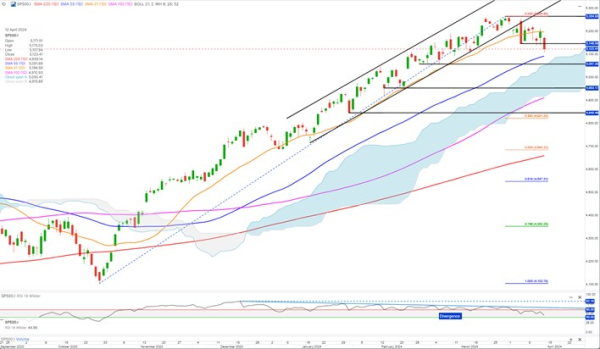
US500 CFD is in a downtrend with short-term potential to support at 5,048. Medium-term down to 4,953-4,920
To reverse this bearish picture a close above 5,277 is necessary. A close above 5,235 will indicate a neutral situation
Nasdaq 100 is holding on above key support at around 17,800.
A daily close below is likely to initiate a sell-off down to around 17,478 possibly down to 17,128-16,963 strong support area short- to medium-term
A daily close above 18,438 will demolish the Bearish Engulfing top and reversal pattern establishing a new bullish trend
RSI divergence is supporting the corrective bearish scenario with
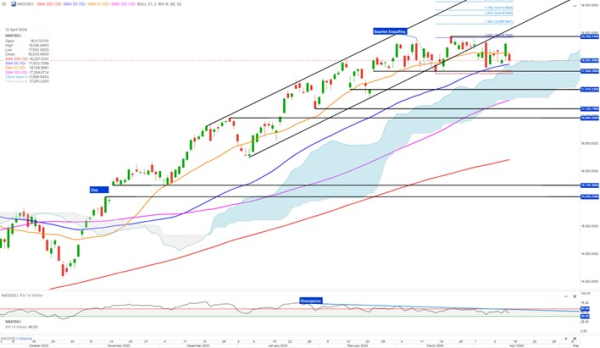
USNAS100 CFD key support at 17,780. A close below downside potential to 17,160
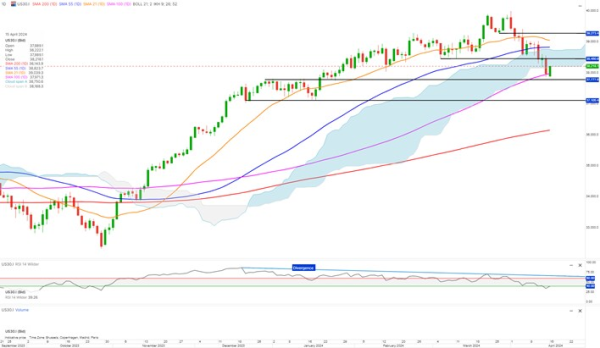
Dow Jones is in a confirmed down trend after the Index close Friday below 38,457 and RSI daily close below 40 threshold i.e., exhibiting negative sentiment
The 100 daily Moving Average is offering a bit of support but the Index seems likely to sell off further towards the support around 37,073
To reverse this bearish trend a daily close above 39,422 is required
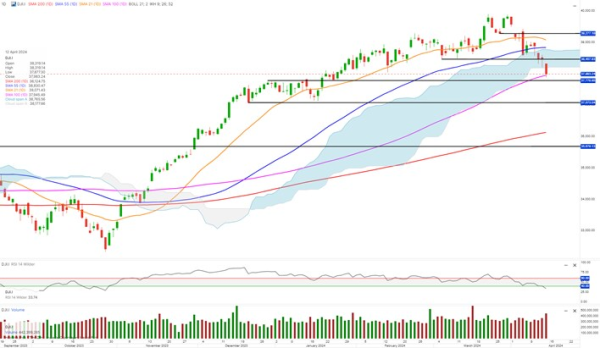
US30 CFD support at 37,778 and 37,105. A daily close above 37,409 necessary for trend reversal