Technical Update - Tesla and Arm Holding bouncing from key supports. Can they establish uptrends?
- Tesla is rebounding from lows at 160.51. Indicators suggesting further rebound short-term. Can it reach resistance at 183-188 area?
- Arm Holdings still holding on above key support. Will it resume uptrend towards all-time highs?
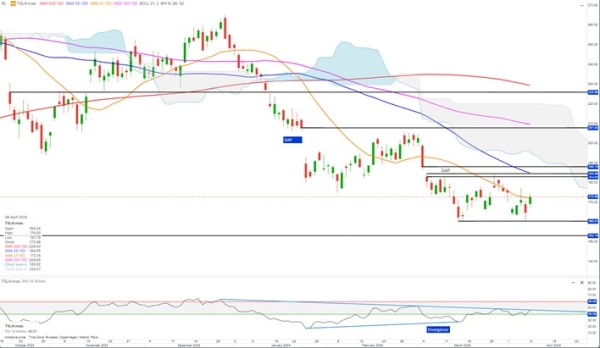
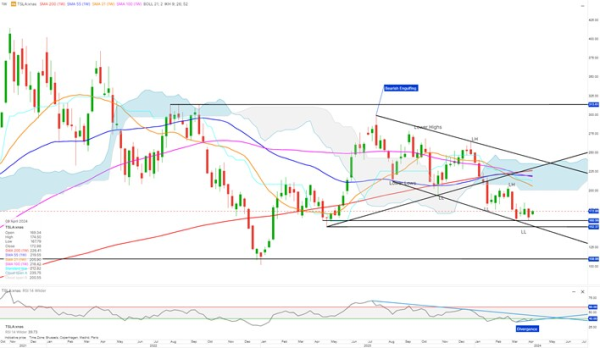
Tesla has recently rebounded from a critical support level at around 160.51, a point that aligns closely with the Q2 2023 support at 160.56, as observed on the weekly chart.
The RSI is currently exhibiting divergence, which could be indicative of a trend reversal. A daily RSI close above the upper falling trendline would bolster the case for a rebound, possibly propelling Tesla toward the 183.05-188.14 gap area.
This potential rebound is further supported by RSI divergence on the weekly chart. RSI divergence in a down trend is a sign of trend exhaustion
For Tesla to confirm a short-term bullish trend, it needs to close above the upper boundary of the gap at 188.14. Achieving this would set the stage for the stock to target the January gap, extending up to 207.83.
Conversely, if Tesla cannot sustain a close above 188.14, the prevailing downtrend may continue. Failure to maintain above 160.51 could lead to a retest of the Q2 2023 low at 152.37. A drop below this threshold might trigger a significant sell-off, potentially driving the stock down to the Q1 2023 lows around 110
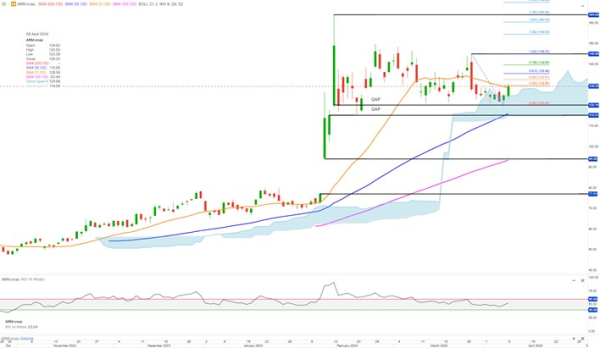
Arm Holdings recently rebounded from the upper boundary of a gap area at 120.16, signaling a potential continuation of its bullish momentum, as it remains above the Ichimoku Cloud (shaeded area). This position above the Cloud indicates an underlying bullish trend.
The RSI is reflecting positive sentiment; however, for the bullish trend to gain more momentum, a close above the 60 threshold is necessary. If Arm can escalate its price to close above 145, it might set the stage for a rally towards all-time highs.
Conversely, if the stock closes below 115.21, it would signify the closure of the current gap, potentially leading to increased selling pressure. Such a move could push the stock towards the lower boundary of the next gap area, around 94.
Bottom line, the gap area at 120.16-115.21 is key