Technical Update - Top and Reversal Signs in SP 500 and Nasdaq 100: Will the Correction Be Shallow or Deep?
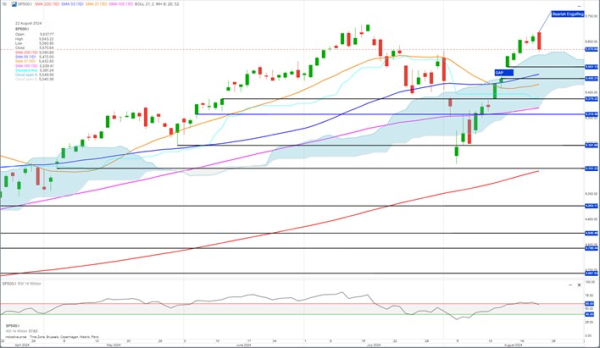
The S&P 500 index formed a bearish engulfing top and reversal-like pattern on Thursday, taking out the previous two days of index gains. A correction is now in the cards.
The strength indicator RSI, which is showing positive sentiment and no divergence (i.e., not indicating uptrend exhaustion), suggests that this is merely a correction rather than a trend reversal. However, the correction could test the gap area between 5,501 and 5,455.
A daily close below 5,455 could lead to further selling down to support at around 5,375.
A daily close above yesterday’s high at 5,644 will cancel the top and reversal pattern and instead extend the bullish move. A test of all-time highs could then be in the cards.
A correction down to the 0.382 retracement at 5,430 is possible, with strong support at 5,403.
A break above 5,643 is very likely to extend the bullish trend towards all-time highs.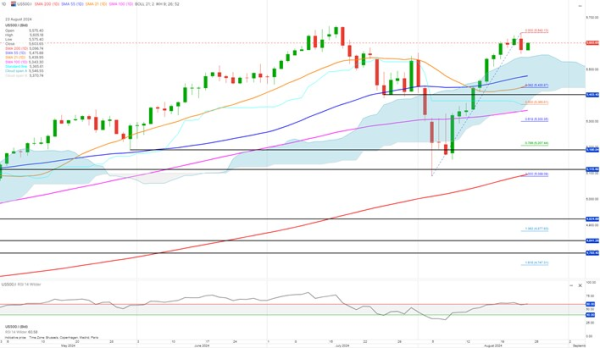
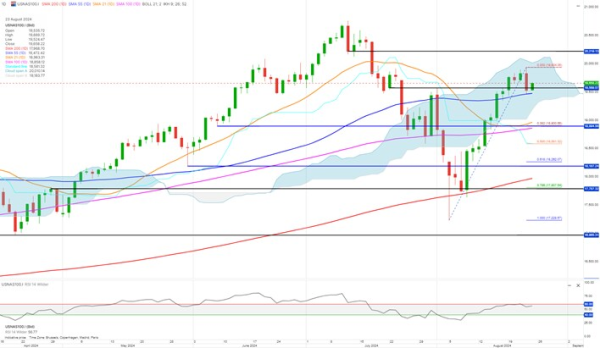
The Nasdaq 100 closed below the support at 19,522, so despite RSI still showing positive sentiment, a correction could hit the Index.
A bearish move down to around 19,000 could be seen.
However, the 55 daily Moving Average is still rising, meaning the correction could be limited.
Key strong support is at around 18,768–18,654.
If the Nasdaq 100 closes above Thursday’s high at 19,393, the top and reversal pattern will be invalidated, and the bullish move is likely to be extended, challenging strong resistance at around 20,211 and possibly reaching all-time highs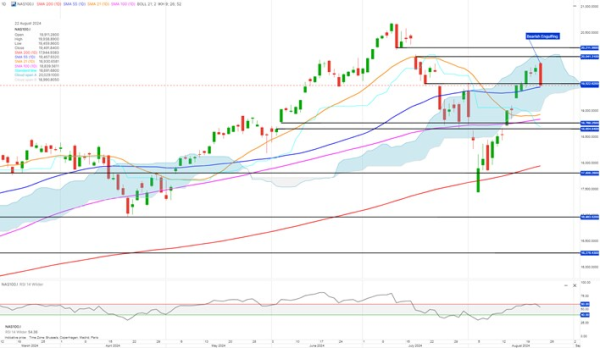
USNAS100 cfd levels: a correction down to 0.382 retracement and support at 18,900 could be occur.
The rising 100 daily Moving Average will add to the support.
A close above 19,934 will extend the bullish move with resistance at around 20,219