Technical Update - USDJPY: Trend exhaustion or continuation? EURJPY and GBPJPY stuck in ranges – which way will they break out?
Key question is: Was that the exhaustive sell-off, or is there more to come?
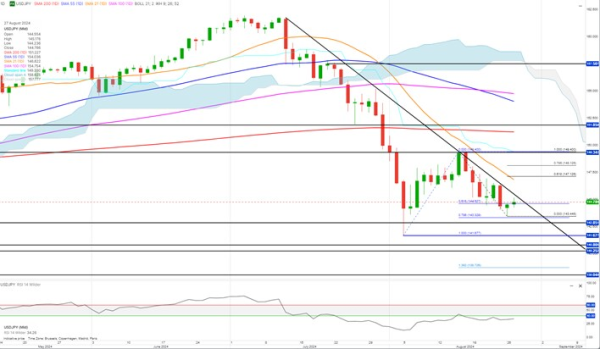
Despite forming what appeared to be a bottom and reversal pattern last week, USDJPY was hit by another round of selling, pushing the pair down to just a few pips above the 0.786 retracement of the early-August rebound at 143.33.
According to RSI, which is showing negative sentiment and no divergence, there is the possibility of lower USDJPY levels.
If sellers push the pair below 143.30, another sell-off could occur, pushing the price down to August lows.
If USDJPY breaks above, and closes above, the upper falling trendline, a bullish move up to the 0.618 retracement at 147.12, maybe even up to the 0.786 retracement at 148.12, could be seen (black Fibonacci levels).
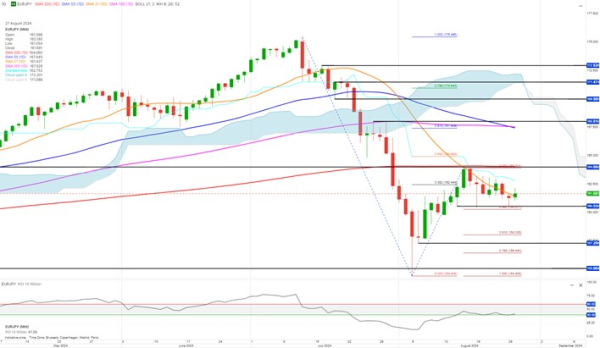
EURJPY tested the support at around 160.55 once again, only to bounce, staying within the range with resistance at around 164.00.
A breakout from that range is required for direction.
The strength indicator, RSI is showing negative sentiment with no divergence, indicating that EURJPY will likely break out bearish. If it does, expect a sell-off down to the 0.618 retracement at 158.03, possibly down to the 0.786 retracement at 156.44.
In case of a bullish breakout, i.e., a close above 164.00, EURJPY is likely to push to strong resistance at around 168.00.
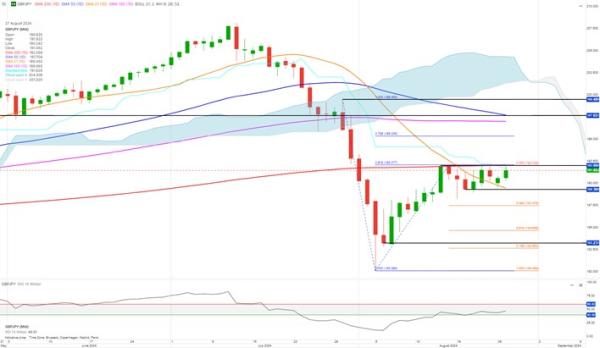
GBPJPY is once again testing resistance at around 192.00. A break above could lead to a buying spree, lifting the pair higher to the 0.786 retracement at 195.35.
If rejected at the 192.00 resistance and instead sliding lower, taking out 189.30, expect a sell-off down to the 0.618 retracement at 184.65 (orange Fibonacci levels).
An RSI close back below the 40 threshold could be the first warning of the bearish scenario to play out