Technical Update - Volatile Crude Oil awaits breakout from corrective pattern; Indicators suggest bearish break with 10-15% downside potential
- Brent and WTI Crude oil forming symmetrical pattern
- Break out needed for direction
- Indicators suggest bearish break out with 10-15% downside potential
We need to zoom out to see what is actually going on with Crude oil.
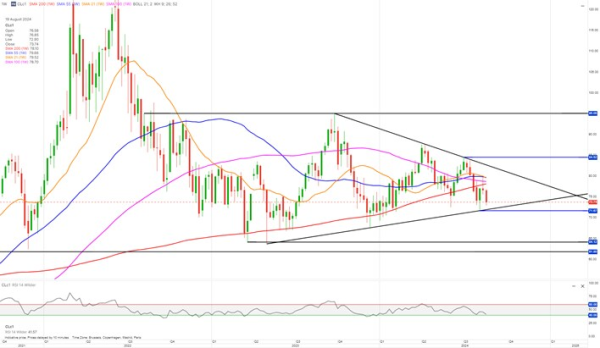
On the weekly chart Crude oil is forming a symmetrical triangle-like formation for both teh Brent and the WTI future.
A breakout is needed for trend direction, and that usually occurs ¾ of the way to the apex (i.e., where the two converging lines meet). Crude oil is currently just about halfway. A breakout now could hurt the distance the price could move.
However, both oil future contracts are trading below all weekly moving averages, with only the 200 weekly moving average rising. The 21, 55, and 100 moving averages are all declining.
That is an indication of an underlying bearish trend short-to medium-term but could indicate oil may move higher in the longer term, supporting the view of a bearish breakout with limited price movement before a bullish comeback.
When a price breaks out of a symmetrical triangle, the minimum distance the price should travel is for a bullish breakout to the top of the triangle and for a bearish breakout to the low of the triangle, but the price could move much farther
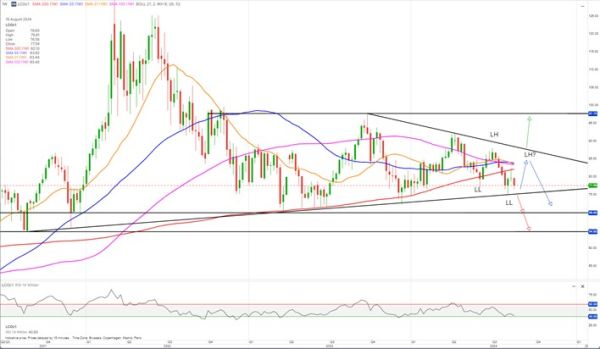
Brent Crude oil:
Brent is currently in a bearish trend (lower lows [LL] and lower highs [LH]) and has been for the past 4–5 months.
A bearish breakout will be confirmed below USD 75.05, with downside potential short- to medium-term to the lowest level of the triangle and strong support at around 69.90. However, a push down to support at around 64.60 could be seen, as indicated by the two red arrows.
For a bullish breakout, a break of the upper falling trendline is required and will be confirmed by a close above 87.95. If that scenario plays out, there is upside potential to around 97.70, indicated by the green arrow.
However, if there is no bearish breakout for the next few weeks and Brent instead bounces from the lower rising trendline, forming a new lower high (a new lower high lower than the previous lower high indicated by LH? and the blue arrows), it could last weeks before a triangle breakout.
The strength indicator is currently testing the 40 threshold. A close below, combined with a Brent oil close below 75.05, will confirm the bearish scenario. An RSI bounce from the 40 threshold could be an indication of the “staying in the triangle” scenario for longer
Levels for WTI Crude oil:
Bearish breakout will be confirmed below 71.67 with downside potential to 64.00–61.80.
Bullish breakout, as the current picture looks, is confirmed above 84.52, but the upper falling trendline will be broken well before that if the bullish scenario is to play out.
Upside potential to around 95, with resistance at around 87.67.