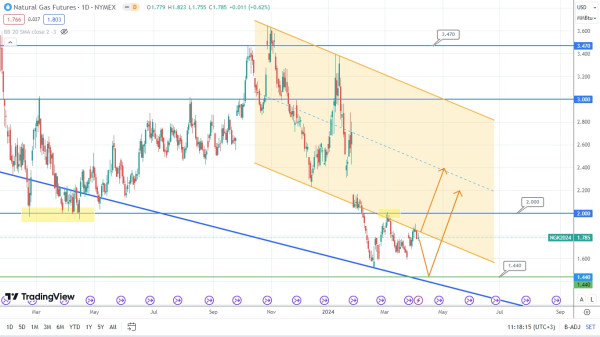
The Natural Gas Market at a Crossroads
The price of natural gas has tested the broken level of 2.00 and closely approached the years-long minimum point, that is, the supporting level of 1.44. In this case, two scenarios are possible. The price of this asset might drop to the level of 1.44, rebound, and rise. Otherwise, it could break the resistance level of 2.00 and form a double bottom. So, let’s observe which scenario of these two might work out.
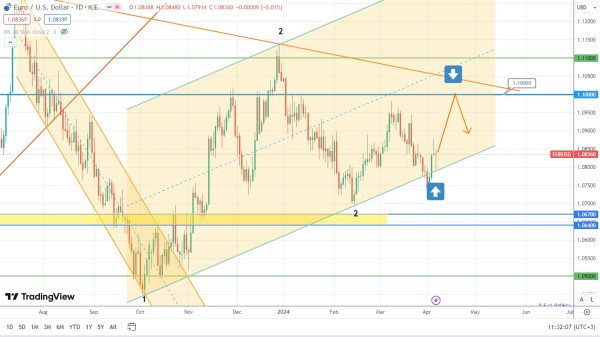
The price of the currency pair EUR/USD rebounded from the uptrend and formed the long-legged Doji at the end of the past trading week. Keeping the recent false breakout of the uptrend in mind, it would be logical to expect the potential price rise. At that, the price of this currency pair might have to face resistance at the level of 1.1000 and head south. Time will tell what might happen next.
The price of Bitcoin keeps moving within the symmetrical triangle, trying to break the level of 68998 to no avail. The asset’s price might eventually undergo correction. However, it might also rise before the Bitcoin halving.