US CPI Preview: US inflation expected to grind lower amid fears about sticky prices
The price information and economic data in this article are sourced from Bloomberg, Reuters
US CPI data is released on Wednesday, 10 April. We preview what to expect from the data, how it could influence US Federal Reserve policy, and analyse the NASDAQ (US Tech 100).
US inflation forecast to grind lower in March
Economists forecast that US CPI edged higher on a headline basis but fell on a core basis in March. Headline CPI is tipped to rise to 3.4% from 3.2% a month earlier, while the more important core figure, which strips out volatile items like food and energy, is projected to moderate to 3.7% from 3.8%.
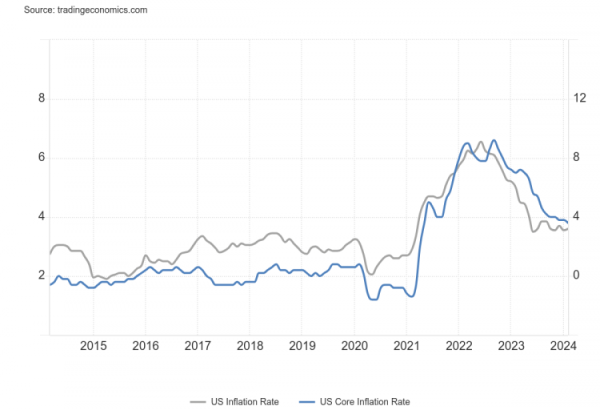 (Source: Trading Economics)
 Whether inflation is still falling or falling fast enough remains a subject of debate amongst policymakers and market participants. Although inflation is still progressively easing, the rate of disinflation has slowed. Arguably, headline inflation is showing signs of re-anchoring around 3%, suggesting stickier price pressures. Recent strength and economic activity, as well as the effects of higher commodity prices and base effects in goods inflation, raise the prospect of inflation running about the Fed’s 2% target.
The higher probabilities of persistent inflation, compounded by strong economic data recently, including a reexpansion in US Manufacturing activity, has led to the market pricing in a later commencement of rate cuts, and fewer cuts in 2024. Following stronger-than-expected US Non-Farm Payrolls figures, which revealed a drop in the unemployment rate to 3.8% and an employment increase of 303,000, futures are moving closer to pricing in as little as two rate cuts this year.
 (Source: Bloomberg)
 The inflation data will preface the latest FOMC Minutes released later in the US session, with market participants searching for clues about the Fed’s expectations regarding interest rate cuts in 2024 and the conditions in which those cuts might occur.
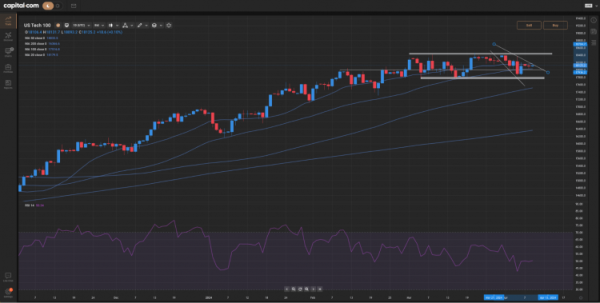
Technical analysis: US Tech 100
US tech stocks could be highly sensitive to an upside or downside surprise in inflation data, with a lower number likely a bullish driver and a higher number a higher bearish driver. The NASDAQ (Capital.com’s US Tech 100 index below) is rangebound in the short term, with the top end of the range at approximately 18,400 acting as technical resistance and the bottom end of the range at approximately 17,800 acting as technical support. A confluence of support/resistance levels also appears around 18,000
 (Past performance is not a reliable indicator of future results)
 The price information and economic data in this article are sourced from Bloomberg, Reuters