U.S. Dollar Gains More Ground: Analysis For EUR/USD, GBP/USD, USD/CAD, USD/JPY
U.S. Dollar Stays Strong
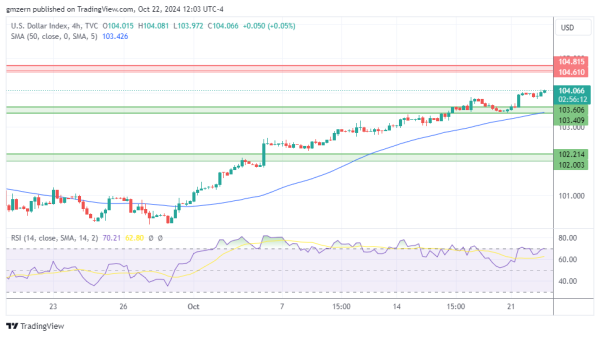
U.S. Dollar Index tests new highs as traders stay focused on rising Treasury yields. The yield of 2-year Treasuries climbed above the 4.05% level, while the yield of 10-year Treasuries settled above 4.20%.
In case U.S. Dollar Index stays above the 104.00 level, it will head towards the nearest resistance level, which is located in the 104.60 – 104.80 range.
EUR/USD Attempts To Settle Below 1.0800
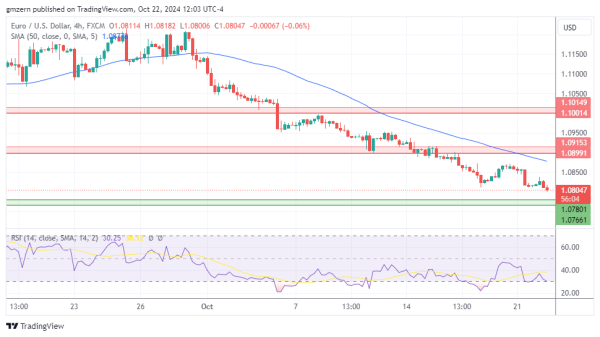
EUR/USD is losing ground as traders bet that the ECB will remain dovish due to the weakness of the European economy.
A move below the 1.0800 level will lead to the test of the nearest support level at 1.0765 – 1.0780. RSI is in the moderate territory, so there is plenty of room to gain momentum in case the right catalysts emerge.
GBP/USD Is Losing Ground As Traders Wait For Catalysts
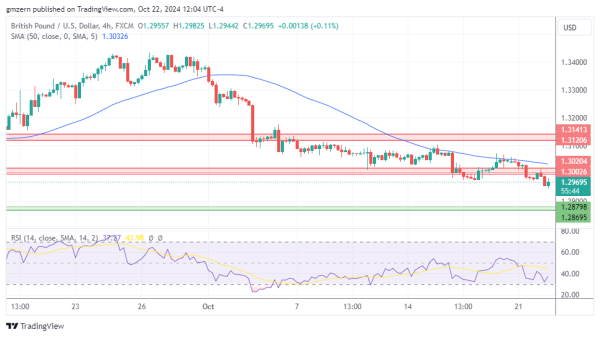
GBP/USD pulled back amid lack of positive catalysts. There are no important economic reports scheduled to be released in the UK today, so traders will stay focused on general market sentiment.
In case GBP/USD settles below the 1.2950 level, it will head towards the support, which is located in the 1.2870 – 1.2880 range.
USD/CAD Settled Above 1.3800
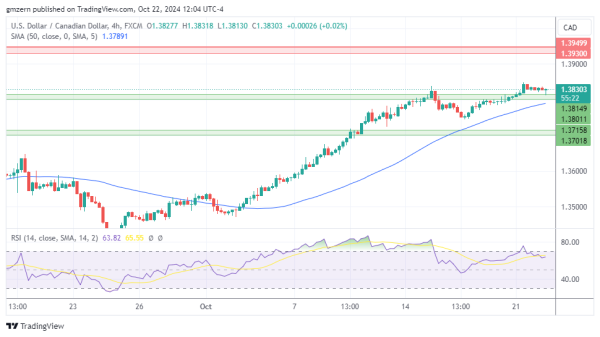
USD/CAD settled above the 1.3800 level despite the rally in commodity markets. Oil rebounds from recent lows, while silver tests multi-year highs. However, these moves do not provide support to the Canadian dollar.
If USD/CAD stays above the support at 1.3800 – 1.3815, it will move towards the resistance level at 1.3930 – 1.3950.
USD/JPY Tests Multi-Month Highs
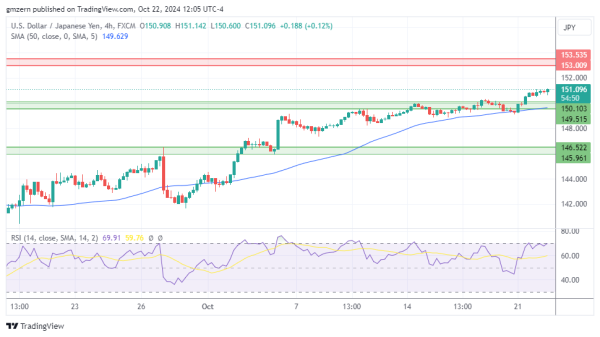
USD/JPY tests new highs as traders stay focused on rising Treasury yields and general strength of the U.S. dollar.
A move above the 151.00 level opens the way to the test of the resistance at 153.00 – 153.50.
For a look at all of today’s economic events, check out our economic calendar.