US Dollar Price Forecast: ECB Rate Decision Looms; Gold, GBP/USD, and EUR/USD Outlook
US Dollar Steady as Gold Rises Ahead of Key US Data Releases
The US dollar remains steady as investors anticipate key data releases today. Core retail sales are forecast at 0.1%, with the same expected for retail sales. Industrial production is forecast to rise by 0.3%, while unemployment claims are projected to hit 241K, down from the previous 258K.
The Philly Fed Manufacturing Index is expected to improve slightly to 4.2 from 1.7. Gold is trading above $2,681, with a potential boost if economic data underperforms, reinforcing expectations for rate cuts.
Investors will closely watch these figures as they could shape both the US dollar’s strength and gold’s trajectory.
US Dollar Index (DXY) – Technical Analysis
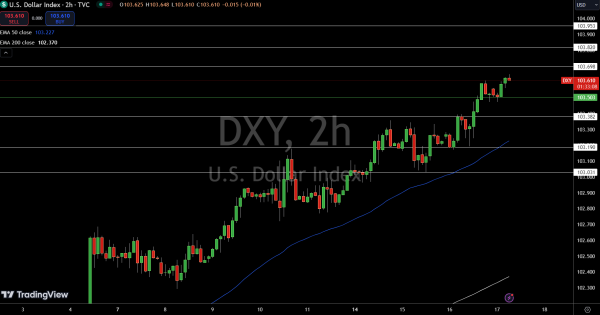
The Dollar Index (DXY) is trading at $103.610, up 0.06%, maintaining a bullish stance above the pivot point of $103.503. Immediate resistance is at $103.698, with further targets at $103.820 and $103.953 if the upward momentum continues.
On the downside, immediate support is seen at $103.382, followed by key levels at $103.190 and $103.031.

The 50-day Exponential Moving Average (EMA) at $103.227 is offering strong support, while the 200-day EMA at $102.370 reinforces a broader bullish trend.
As long as the Dollar Index stays above $103.503, the outlook remains positive, but a break below this pivot could trigger a sharp selling trend.
Gold – Technical Analysis
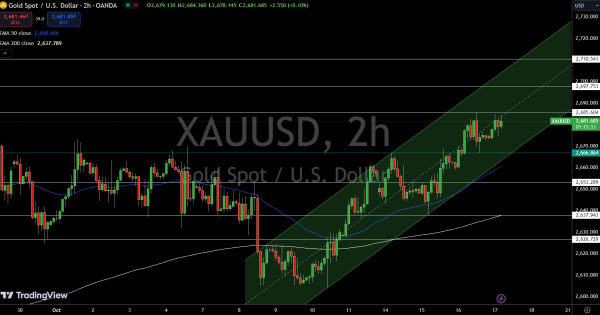
Gold (XAU/USD) is trading at $2,681.69, up 0.31% for the day, holding above the key pivot point at $2,666.86.

A break above $2,685.60 could push prices toward $2,697.75 and $2,710.54, while immediate support lies at $2,653.29. The 50-day EMA at $2,660.61 and 200-day EMA at $2,637.79 support the bullish outlook above $2,666.86.
Sterling Slips as Inflation Data Misses Forecasts
The British pound remains under pressure after softer-than-expected inflation data released yesterday. The CPI came in at 1.7%, below the forecast of 1.9%, while the core CPI also missed expectations at 3.2%.
The PPI Input fell 1.0%, more than the forecasted 0.5%. Additionally, RPI slipped to 2.7% against an expected 3.1%.
This weaker inflation data has raised concerns over the Bank of England’s next steps on monetary policy, dampening sterling’s strength as investors reassess the currency’s outlook amid slowing price growth and subdued economic conditions.
GBP/USD Technical Analysis
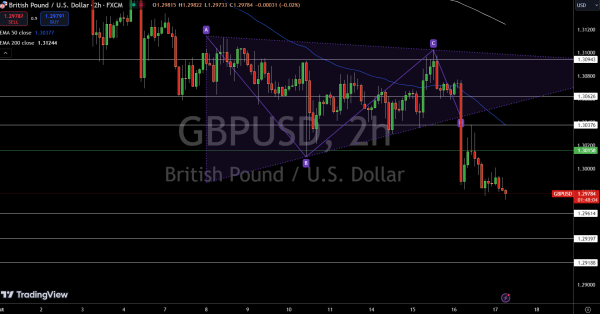
GBP/USD is trading at $1.29784, down 0.02%. Bearish momentum prevails after breaking below a symmetrical triangle pattern. The price hovers below the pivot point at $1.30158, a critical level.
Immediate support is found at $1.29614, with further support at $1.29397 and $1.29188. On the upside, resistance stands at $1.30376, followed by $1.30626 and $1.30943.

The 50-day EMA at $1.30377 is acting as a key resistance, reinforcing the bearish sentiment in the market.
A break above $1.30158 could shift the trend toward a more bullish outlook, but for now, sellers remain in control.
Euro Awaits ECB Decision Amid Key Economic Data
The euro is in focus today as the European Central Bank’s rate decision and press conference take center stage. Key data include the Final Core CPI at 2.7% and the Final CPI at 1.8%, both in line with expectations.
The eurozone trade balance improved to €17.8B, while Italy’s trade surplus fell short at €5.55B. Later, the ECB is expected to keep the main refinancing rate steady at 3.40%.
Traders will closely monitor the ECB press conference for insights into future monetary policy, which could influence the euro’s short-term direction.
EUR/USD Technical Forecast
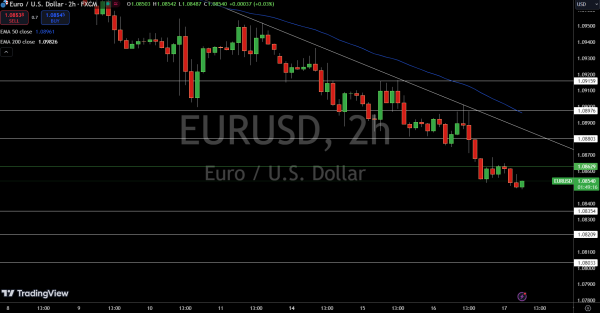
The EUR/USD is trading at $1.08540, down 0.08%, as bearish momentum continues to dominate. The price is below the pivot point at $1.08629, signalling further downside risk. Immediate support lies at $1.08354 and stronger levels at $1.08209 and $1.08033.
If these levels hold, we might see some stabilization, but a break below could accelerate the decline. Resistance stands at $1.08803, with further challenges at $1.08976 and $1.09159.

The 50-day EMA at $1.08961 adds to the bearish bias, while the broader trend remains weak after breaking a symmetrical triangle pattern. A move above $1.08629 could shift sentiment, but for now, the bears are in control.