US Dollar Price Forecast: Will Strong Data Drive DXY Higher? Gold, GBP/USD, and EUR/USD Outlook
U.S. Dollar Gains as Unemployment Drops; Gold Faces Pressure from Strong Data
The U.S. dollar gained strength following solid economic indicators, with Unemployment Claims dropping to 227K, showing labor market resilience. Additionally, higher-than-expected Flash Services PMI at 55.3 supports economic optimism, pressuring gold’s safe-haven appeal.
As gold trades around $2,725, further USD gains could exert additional downward pressure on the metal. Upcoming data, including Core Durable Goods Orders and Revised UoM Consumer Sentiment, may impact dollar strength, potentially guiding gold’s near-term trajectory.
Should the dollar continue strengthening amid positive economic signals, gold might struggle to find support, barring any geopolitical uncertainties or inflationary concerns.
US Dollar Index (DXY) – Technical Analysis

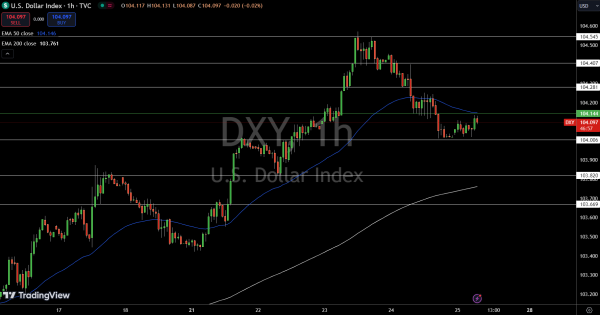
The Dollar Index (DXY) is currently trading at $104.123, up by 0.10%, but hovers close to a key pivot point at $104.144. This level aligns with the 50-day EMA of $104.146, marking it as a critical zone for short-term direction.
Should DXY break above $104.15, we might see upward momentum build, pushing toward immediate resistance at $104.281, with additional targets at $104.407 and $104.545.
However, if the dollar falls below $104.144, support at $104.006 could be tested, with further downside risk toward $103.820. Traders should note that maintaining above the pivot is essential for sustaining a bullish trend in the near term.
Gold – Technical Analysis

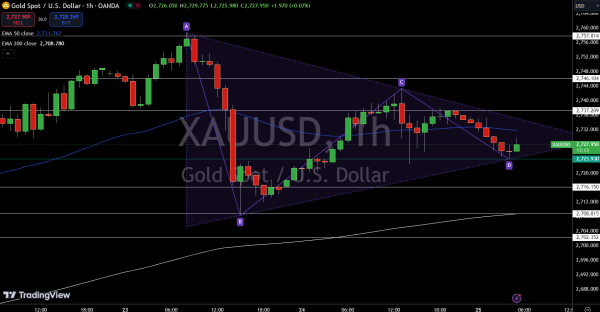
Gold (XAU/USD) is trading at $2,727.97, down 0.29%, testing the critical pivot point at $2,727.95. Holding above could lead to resistance at $2,737.21 and beyond, while a break below might push prices to supports at $2,716.15 and $2,708.82.
The 50-day EMA ($2,731.77) signals cautious bullish sentiment, but traders should monitor these levels closely for possible moves.
Sterling (GBP) Pressured as PMI Misses Forecasts
Sterling (GBP) has faced downward pressure after both the Flash Manufacturing PMI and Flash Services PMI fell below forecasted levels, coming in at 50.3 and 51.8, respectively. These figures highlight a potential slowdown in the UK’s economic growth.
With Bank of England Governor Andrew Bailey’s remarks and today’s Monetary Policy Report Hearings, markets are closely watching for hints on future rate policies.
The IMF meetings may also add insights into broader economic impacts on the pound.
GBP/USD Technical Analysis

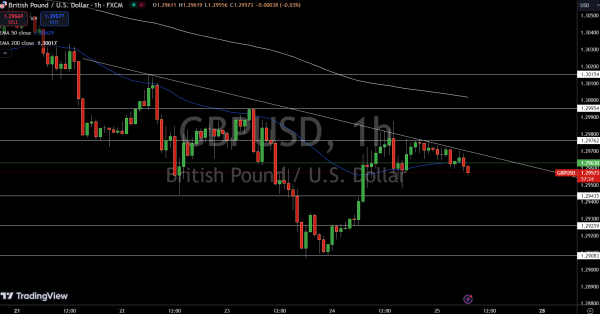
GBP/USD is trading at $1.29558, down 0.14%, and sits just under its pivot point at $1.29630, a level that’s been key in setting the short-term tone. The 50-day EMA at $1.29629 aligns closely with this pivot, reinforcing it as resistance.
If GBP/USD can push above $1.29630, the pair could aim for the next resistance at $1.29762 and possibly reach $1.29954.
On the downside, immediate support lies at $1.29435, with further declines likely targeting $1.29259.
Euro (EUR) Faces Downward Pressure as Manufacturing PMI Slips
The Euro (EUR) showed signs of pressure as French and German Manufacturing PMIs both missed forecasts, with France at 44.5 and Germany at 42.6. Services PMIs also fell, indicating a slowdown in the Eurozone’s private sector.
Upcoming data releases, including the Spanish Unemployment Rate and Germany’s Ifo Business Climate Index, are anticipated to shape short-term market sentiment. Investors are also watching for the M3 Money Supply and private loans data to assess economic stability.
Overall, mixed data adds to concerns over the Eurozone’s resilience, potentially weakening the euro further if economic indicators continue underperforming.
EUR/USD Technical Forecast

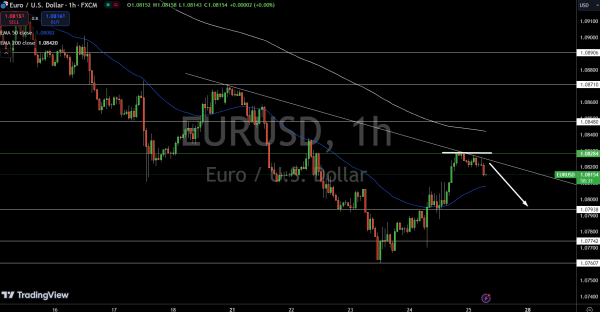
EUR/USD is currently trading at $1.08138, down 0.13%, and is testing the 4-hour pivot point at $1.08284. This level serves as a key marker—holding below it keeps the bearish bias intact, with immediate support at $1.07938 and further downside potential at $1.07742.
A downward trendline is reinforcing this bearish outlook, aligning with resistance from the 200-day EMA at $1.08420. However, if EUR/USD manages a break above $1.08284, a test of the next resistance level at $1.08480 could open the door for more upside movement.