US100 drops ahead of NFP 📉
⌚ Key US labor market report at 1:30 PM BST
-
Market consensus indicates a decrease in the number of employed persons to 175k in July from 206k in June.
- Private sector employment excluding agriculture: forecast 148k; previous 136k;
- Unemployment rate: forecast 4.1%; previous 4.1%;
- Labor force participation rate: previous 62.6%;
- Average hourly earnings: forecast 3.7% y/y; previous 3.9% y/y;
-
Considering the negative surprise from the ADP data, higher unemployment claims, and other macroeconomic data, it is likely that the NFP report will also fall below consensus.
-
Bloomberg analysts estimate that employment growth in July will fall to 142k, significantly below the official consensus of 175k.
-
Hurricane Beryl, which hit Texas on July 8, may have a negative impact on the reference period for both households and businesses. Estimates suggest that weather conditions could reduce private sector employment by as much as 20k.
-
The negative impact of the hurricane and declining labor market demand should reduce the average weekly hours worked to 33.8 from 34.3.
-
Assuming the participation rate remains at 62.6%, the unemployment rate is likely to stay steady at 4.1% in July.
-
Employment growth slowdown is expected primarily in the manufacturing sector and sectors particularly affected by extreme weather conditions such as construction, food services, and retail.
What Fed expects?
Powell emphasized during the last FOMC conference that significant progress has been made in bringing inflation back to target, with disinflation visible in nearly all sectors of the economy. This has weakened consumer spending, and the labor market is no longer excessively heated. When asked about a rate cut in September, he indicated that it remains on the table and will depend on the data. Before the Jackson Hole symposium, where analysts expect final confirmation of the intention to cut rates, we will receive another inflation reading and the latest labor market data. These data should be enough to provide a clear signal on whether a rate cut will become the baseline scenario for the September meeting.
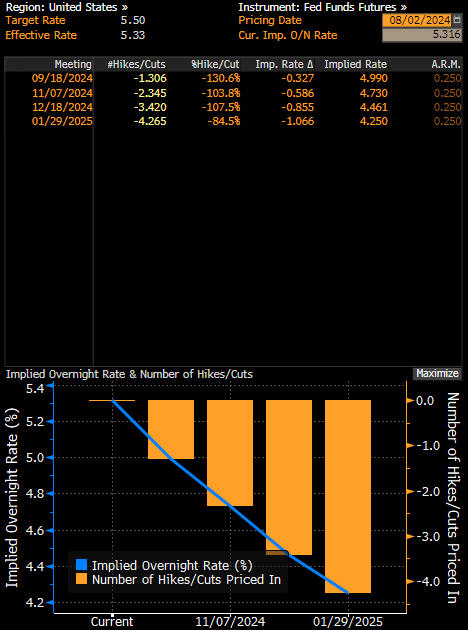
The swap market indicates that the Fed will cut rates by a total of 86 basis points by the end of the year. Before Wednesday's Fed decision, it was 69 basis points. Rate cuts in September and November have already been fully priced in by the market. Source: Bloomberg Finance LP.
What do other macro data suggest?
Recent data confirm the stabilization of the labor market. The latest statements by Jerome Powell at the post-FOMC decision conference suggest that the Fed will pay increasing attention to the labor market's condition. As a result, today's NFP report could significantly influence expectations for rate cuts this year.
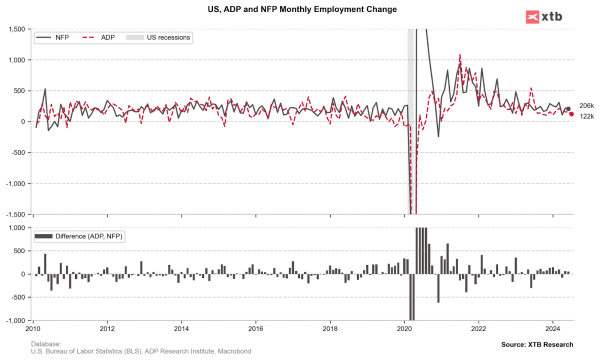
The ADP report on Wednesday showed a job increase of 122k versus expectations of 150k and 155k the previous month. Although these data usually fall slightly below NFP figures, they remain highly correlated. Therefore, the negative surprise on Wednesday may also suggest a similar result in today's release.
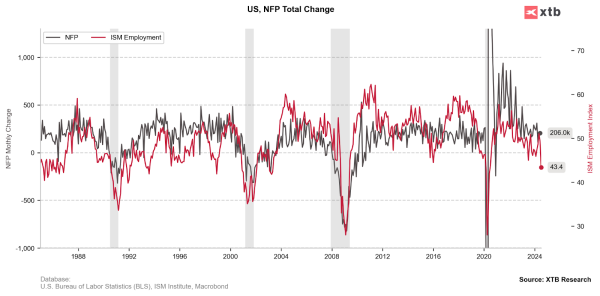
The ISM report for the manufacturing sector was much worse than market expectations, causing panic among investors. Even worse was the employment sub-index, which came in at 43.4, reaching its lowest level since June 2020. Among the 18 manufacturing industries, only 2 industries reported employment growth in July, while 13 industries experienced declines.
Additionally, higher weekly jobless claims must be taken into account. The latest report showed an increase to 249k compared to expectations of 235k. The data suggests that the labor market is cooling at a slightly faster pace than expected, which also increases the likelihood of a negative surprise in today's NFP report.
US100 (D1)
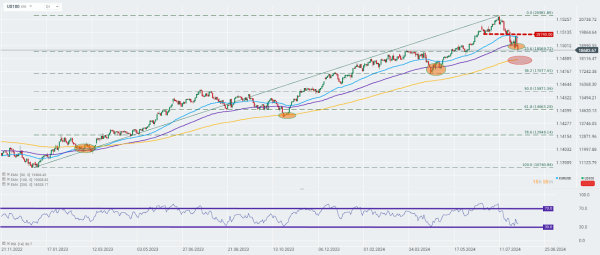
The US100 index has already fallen by 11% from its peaks. Moreover, today's session led to a breach of the 100-day exponential moving average (purple curve on the chart), which has historically been an important support point on the chart. If the demand side fails to return above this barrier soon, the likelihood of a deeper downward correction will increase. In such a case, the 200-day exponential moving average (golden curve) could serve as a potential support point. Source: xStation