USD/CHF: outlook on September 12
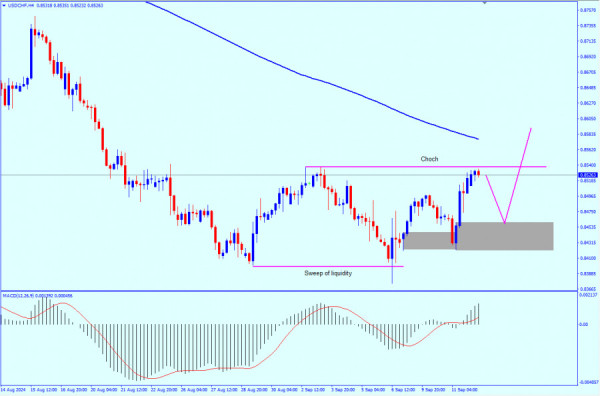
As for the four-hour time frame, reaching the daily POI is somewhat far away. So, it is possible to take buy positions due to the presence of good signs of decline. The currency pair may rise due to the sweep of liquidity that occurred at the 0.83985 level to break the current peak, and fall to rebound from the 0.84600 order block.
Points of interest (POI)
Buy from: 0.84600 (after breaking the current high at 0.85377)
TP 1: 0.85377 (first structure point)
TP 2: 0.8748 (daily structure)
Stop loss: 0.84200 (below the OB & the OF too)
Monthly chart
The USD/CHF pair has made lower lows. It is expected to continue this downtrend on the monthly time frame as there is no signal for the pair to break the previous high. The instrument may rebound from the level of 0.88225, Besides, the presence of the 200 moving average above this level supports the decline.
Weekly chart
The weekly time frame also supports the decline due to the presence of the IDM before the order block, which coincides with the monthly order, but it is better to wait for a weekly candle to close within the order block range.
Daily chart
Almost the same thing is detected in the daily time frame, but the picture has become clearer, as the moving average 200 is very close to the order block, which supports the decline. There is also an IDM in the daily chart, where it is possible to open sell orders at the order block, where the moving average is located.