Why fear beats greed in volatile cycles?
In a financial landscape where uncertainty reigns, the battle between fear and greed becomes pivotal. This article delves into the dynamics of volatile cycles, revealing why the instinct to avoid loss often overpowers the desire for gain.
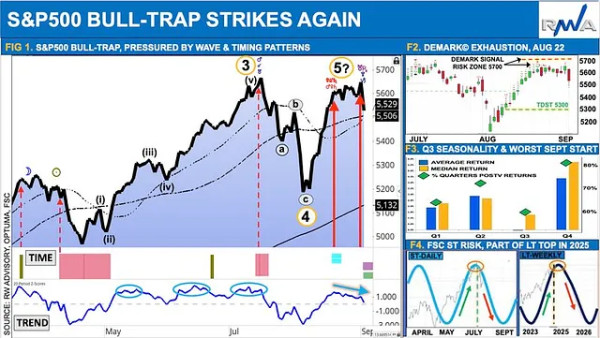
Brace yourself for the worst September equity market start in nearly a decade. This marks an expected Q3 asymmetric risk, weighed by strong H1 2024 performance and LT corrective pattern (Figure 1–3).
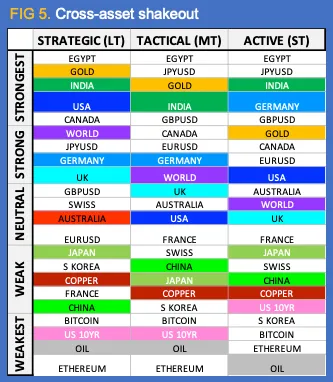
Tremors from the August flash crash also prevailed on my cross-asset model (Figure 5), with S&P500’s bull-trap striking again, led by a tech sector plunge and JPY jump. It occurred amidst weaker than expected manufacturing data and a big drop in oil on concerns about softer global demand. Finally, the VIX ‘fear gauge’ spiked and 10 years US Treasuries tumbled, all ahead of the Fed’s long-awaited rate cut.
Recall my earlier warning of the equity market’s triple whammy headwinds, featured in media interviews, notably Real Vison & CNBC.
This comprises of:
- Momentum historical unwind
- Rotation fragility
- Bearish timing confluence.
All factors remain in play, most notably rotation fragility, led by concentration risk, which became the Achilles heel of the market’s irrational exuberance. This is compounded by the risk scenario, based on a ‘rhyme’ hitting Y2K bubble extremes, coupled with the high beta impact of the FAANG stocks.
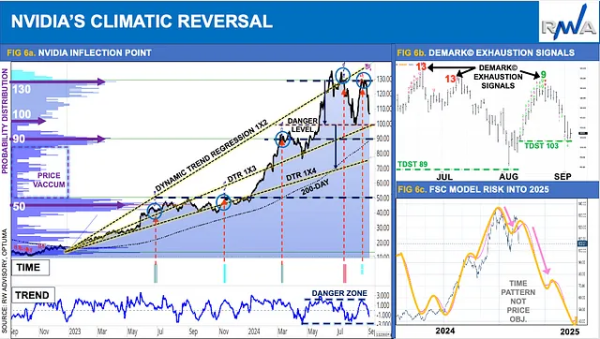
NVIDIA, which served as the poster child, drove more than 30% of S&P500 H1 gains, but has now triggered a sharp correction that deleted a record $279bn of market value. Expect further mean-reversion sub-$100, into $90, near the LT 200-day trend (Figure 6ab). This also equates to a near 30% peak-trough drawdown, akin to its prior summer bear setup. Only a sustained close under 90 will unlock further downside risk, in line with the FSC’s timing signal into the new year of 2025 (Figure 6c).
How much of a domino effect is likely to weigh on markets? One top of mind indicator, signalling red alert, is the ratio of S&P500 market cap vs. equal weighted, which hit an important threshold outperformance of 15%, within a two-year period, which typically leads to a breaking point event risk.
This chimes with the bearish timing confluence during September and October, into the US elections, as part of a LT strategic top into 2025. In behavioural terms, fear beats greed in volatile cycles. It’s time to prepare for a switch from FOMO to FOLO (fear of losing out).
The performance equity curve (Figure 7) demonstrates the cyclical nature of market asymmetry which dictates that top returns, ex-worst 10 days, moderate in buy & hold strategies and relative bottom returns, ex-best 10-days. Capturing a blend of profitable trades and smart risk management is key.
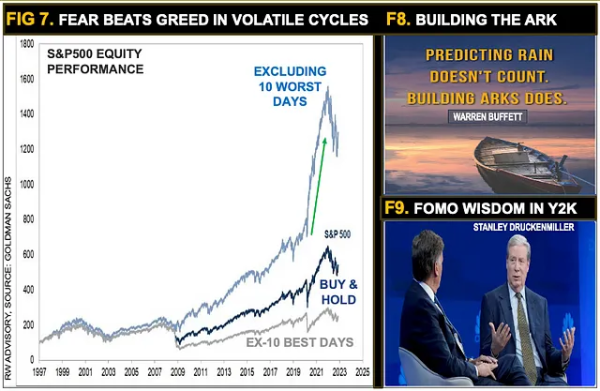
A barbell strategy remains prudent. Continue to trim profits, hedge downside risk and build smart diversification. It’s worth remembering the lessons from top investor pioneers. Warren Buffett warns of the importance of risk management in his biblical reference to the Noah’s Ark principle “predicting rain doesn’t count, building arks does” (Figure 8). While Stanley Druckenmiller recalls his worst trading mistake during the Y2K — due to FOMO extremes and the urge “to play” following a 30-year positive track record (Figure 9). In both life and markets, timing is everything.
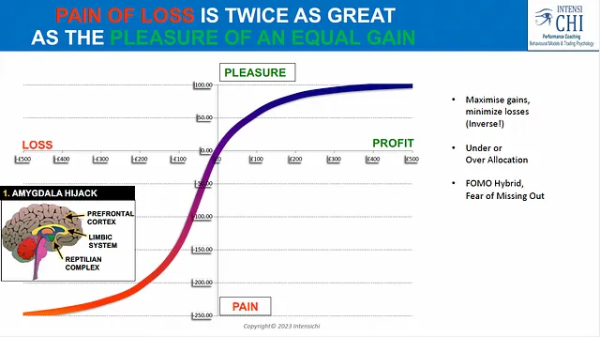
Alas, it may prove challenging for most, given the Nobel prize winning behavioural work of Daniel Kahneman. His well-known prospect theory states that investor decision-making depends on choosing options that may themselves relate to biased judgements. A case in point is the unequal relationship between risk and reward, whereby the fear of portfolio loss can loom twice as large as the greed for profit (Figure 10). During fast changing markets, we must learn how to adapt both our market and mind strategy!
